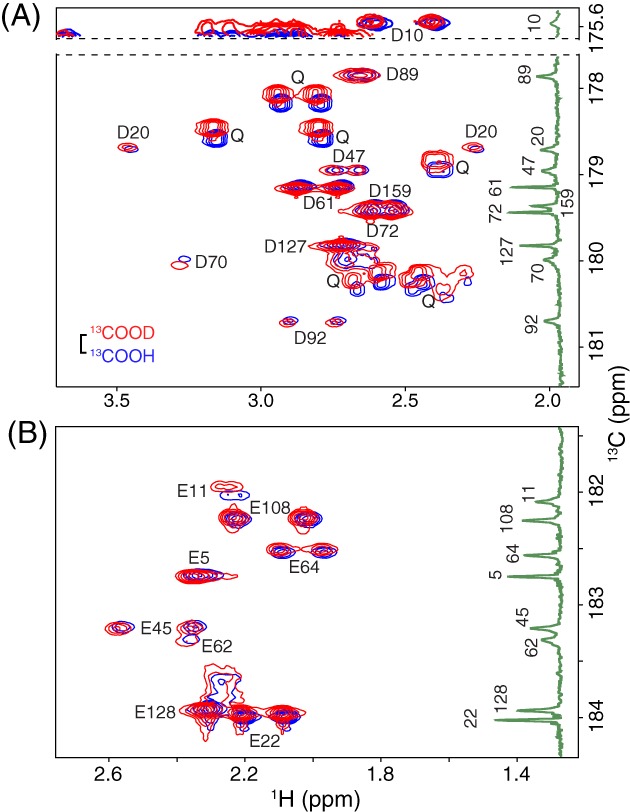
Figure 4.

Selected regions of the 2D Hβ/γ 2(Cβ/γ)Cγ/δ spectra of uniformly 15N/13C‐labeled T26H–T4L* in H2O (blue; pH 5.8) and D2O (red; pH* 5.7) NMR sample buffer. The spectra show correlations between (A) the Hββ’ and 13Cγ of Asp and (B) the Hγγ’ and 13Cδ of Glu. The vertical insets are the 1D 13C‐NMR spectra of protein selectively labeled with (A) 13Cγ‐Asp or (B) 13Cδ‐Glu at pH 5.9 (taken from Fig. 3). The scale bar indicates the expected 0.23 ppm isotope shift for a neutral carboxylic acid (13COOH vs. 13COOD). The lack of any significant isotope shifts (< 0.04 ppm in magnitude) demonstrates that the Asp and Glu residues in T26H–T4L* are predominantly ionized under these conditions. Two exceptions are the small 13Cδ shift of 0.08 ppm exhibited by Glu11 (pK a 4.7) that is attributed to a change in its fractional ionization due to the slightly different pH/pH* conditions, and the slight “reversed” isotope shift of Asp70 13Cγ (−0.07 ppm) that may possibly result from protonation versus deuteration of its hydrogen bonded partner His31.22, 23 Also seen in (A) are 15N‐coupled signals from several Gln sidechains, which show expected20, 24 deuterium isotope shifts (13CONH2 vs. 13COND2) of ~ 0.12 ppm. Signals from the Asn sidechains, with similar isotope shifts, are outside of the presented 13C chemical shift windows.
