
Figure 4.
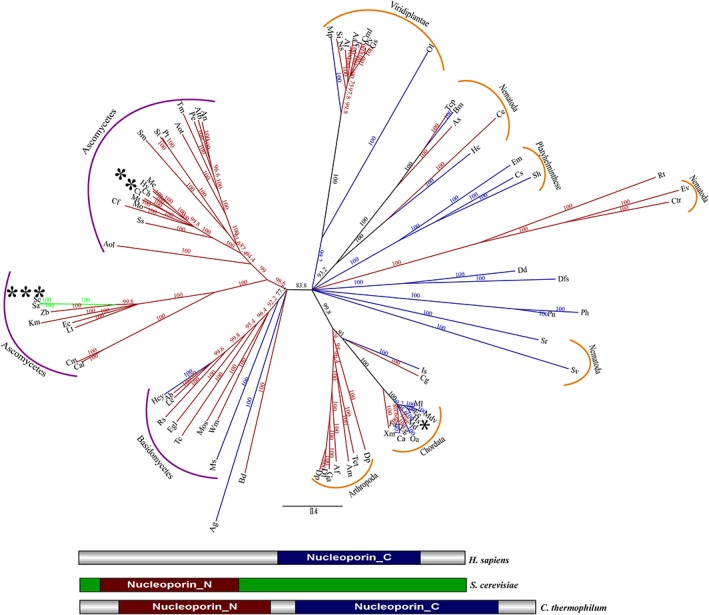
Phylogenetic analysis and domain organization of Nup133 homologs. Based on structure‐guided multiple sequence alignment, representative homologs of Nup133 were subjected to phylogenetic analysis (neighbor‐joining). In the unrooted tree, branch labels represent the percentage bootstrap values and the branch length is scaled to evolutionary distance. The branches are colored according to the type of domain present in different species, blue represents species predicted to have only Nucleoporin_C domain, green predicted to have only Nucleoporin_N domain and red depicts that both Nucleoporin_N and Nucleoporin_C were predicted for these group of species. The domain organization of the three classes of Nup133 is shown below the tree. The species names are abbreviated for the ease of representation and the detailed information is provided separately in Table S9 (* H. sapiens, ** C. thermophilum, and *** S. cerevisiae). The fungal species are grouped under purple color and the metazoan species under the orange color bars.