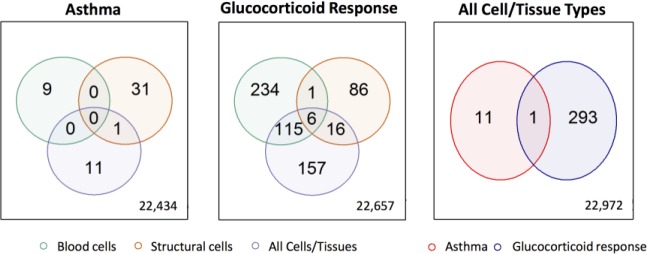
Figure 4.
Comparison of genes with significant expression changes across cell/tissue types for asthma studies (left) and glucocorticoid response studies (center), and in asthma vs. glucocorticoid response datasets across all cell/tissue types (right). The total number of genes available for each comparison is shown on the bottom right of the corresponding diagram.

