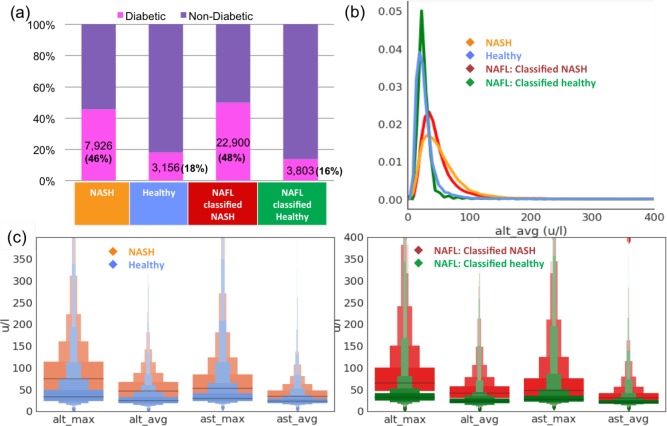
Figure 6:
XGBoost classifier’s predictions on the Optum EHR NAFL cohort (a) Prevalence of diabetes in the NAFL cohort classified as NASH is significantly higher than in the NAFL cohort classified as Healthy. (b) The distributions of longitudinal average of ALT values (most important lab-based feature learnt from classifier), ‘alt avg’, for the NASH patients is similar to the distribution in NAFL patients classified as NASH. (c) Distributions of relevant labbased longitudinal parameters are summarized in the Letter Value box-plots26 indicating the various quartiles of the distribution (grey lines correspond to the middle-quartiles or the medians).

