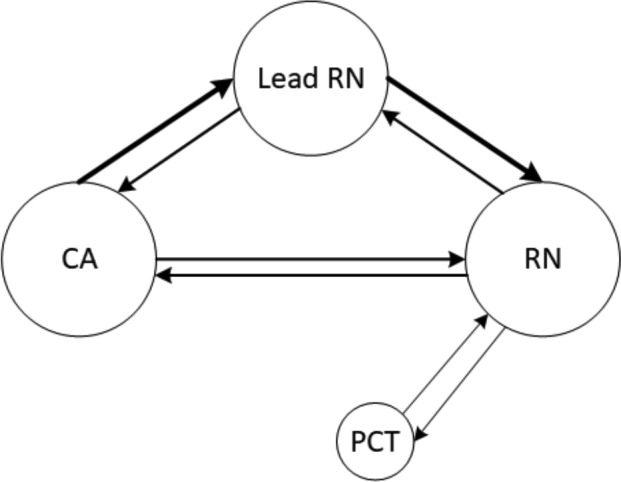
Figure 3:

Clinician and staff social network. Circles correspond to roles, and larger circles indicate that the role generated a large number of event logs. Arrows correspond to interactions, and thicker arrows indicate that an interaction occurred more frequent
