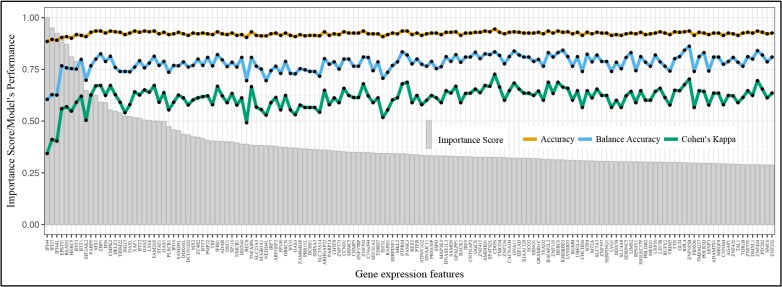
Figure 2.
Gene expression feature importance profile of treatment naïve systemic lupus erythematosus patients (top 100 features listed). Results from step b, containing 681 gene expression features that differentiate treatment naÍve SLE patients from healthy controls and SLE patients exposed to various treatment. Feature importance profile includes: i) scaled importance score (grey bars) and ii) corresponding out-of-sample classification accuracy of sample type (HC/SLE treatment naÍve/SLE treatment) from adjusted TPOT-recommended pipeline with iterative inclusion of features from left to right (orange, blue or green lines). The y-axis represents both the MultiSURF scaled importance score and TPOT pipeline accuracy.

