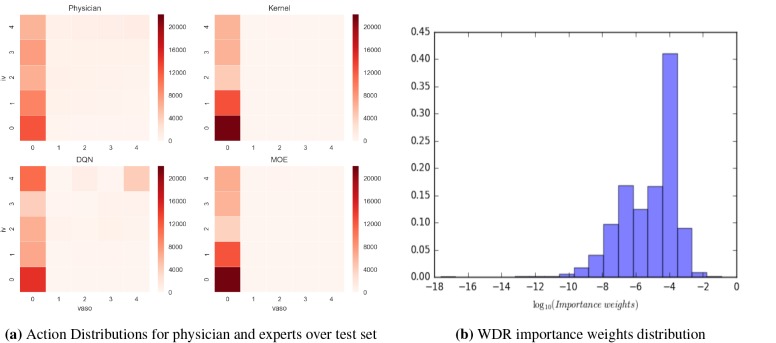
Figure 3:
The left heatmap shows action distribution of each expert. Action assignment starts at bottom left corner (action 0) in the grid and increases from left to right, with action 24 (max level of fluid and vasopressor) corresponding to the top right corner. The MoE is much akin to the conservative kernel expert, suggesting most of the patients can find similar neighbors. The right chart plots the full distribution of importance weights. A significant number of weights lie in the range of [10–4, 10–3] and only very few observations have weights significantly larger than that range.

