
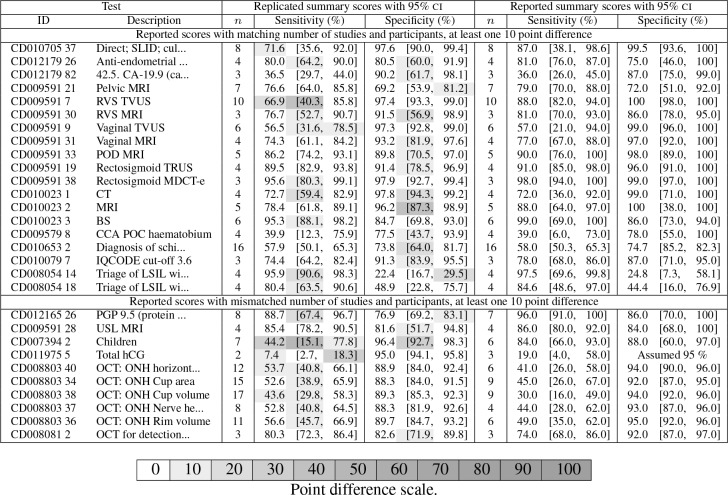
Table 2:
Replicated vs reported summary score pairs differing from the reported summary scores by at least 10 point on one of the six scalar values (one cell per row in the table). Larger differences are highlighted.
 |
Official websites use .gov
A
.gov website belongs to an official
government organization in the United States.
Secure .gov websites use HTTPS
A lock (
) or https:// means you've safely
connected to the .gov website. Share sensitive
information only on official, secure websites.
Replicated vs reported summary score pairs differing from the reported summary scores by at least 10 point on one of the six scalar values (one cell per row in the table). Larger differences are highlighted.
|