Abstract
We report recent progress in the development of a precision test for individualized use of the VEGF-A targeting drug bevacizumab for treating ovarian cancer. We discuss the discovery model stage (i.e., past feasibility modeling and before conversion to the production test). Main results: (a) Informatics modeling plays a critical role in supporting driving clinical and health economic requirements. (b) The novel computational models support the creation of a precision test with sufficient predictivity to reduce healthcare system costs up to $30 billion over 10 years, and make the use of bevacizumab affordable without loss of length or quality of life. (c) Connecting development of precision medicine tests to Randomized Clinical Trials enhances the robustness of computational modeling, accelerates development and validation of the precision test by 5-10 years, is highly generalizable and scalable, and should thus be considered as a high-priority design for similar precision medicine efforts.
Introduction
Clinical problem. Epithelial ovarian cancer (OVCA) has the highest mortality rate of all gynecologic cancers1 with the majority of patients diagnosed with stage III or IV disease2. Additionally, 20-30% of patients will not respond to standard initial treatment consisting of cytoreductive surgery and platinum- based chemotherapy3. Patients are considered platinum-refractory if they progress while on treatment or platinum-resistant if their disease recurs less than 6 months from completion of the initial platinum- based chemotherapy. Even in patients who have a complete initial response to chemotherapy, 80% will recur and eventually develop resistance to multiple drugs and die from drug-resistant disease4. Efforts are ongoing to study novel, targeted agents, including bevacizumab, an anti-angiogenic monoclonal antibody against vascular endothelial growth factor (VEGF). Two phase III frontline trials in ovarian cancer (ICON7 and GOG 218) showed statistically significant improvements in median progression free survival (PFS) of 2.3 and 3.8 months, respectively, when bevacizumab was added to standard first-line chemotherapy5,6.
Bevacizumab was approved by the FDA for unselected frontline use in ovarian cancer in the US in June of 2018. Unfortunately only a subgroup of patients benefits significantly whereas the majority benefit moderately or do not benefit. The problem is further compounded by the high cost of bevacizumab which is currently $400,000 per progression free life saved in the USA7, thus making treatment of all patients economically infeasible and the patients who can afford the drug are not necessarily the ones who will benefit from it. This underscores the pressing clinical need for more individualized treatment strategies.
Our central hypothesis is: Response to platinum-based chemotherapy and anti-angiogenic treatment with bevacizumab can be predicted using clinical and molecular tumor characteristics in patients with ovarian cancer. This predictive capability can lead to the creation of a clinico-molecular test to guide improved treatment strategies.
In prior work from our group, gene expression analysis of ovarian cancers performed in The Cancer Genome Atlas (TCGA) has led to a molecular classification of four subtypes8,9. We recently demonstrated that these four subgroups have prognostic significance5. In addition, we have previously demonstrated differential response to bevacizumab and platinum-based chemotherapy within those four molecular subtypes using formalin-fixed paraffin-embedded (FFPE) tumor samples from the ICON7 clinical trial10,11.
In the present work we report on discovery and statistical validation of a new clinico-molecular stratification model with sufficient accuracy to be clinically actionable.
Informatics and Data Science Methodology and Research Design Considerations
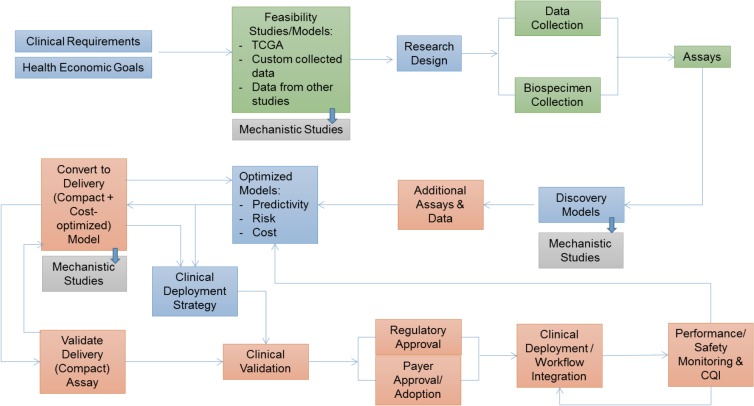
The overall framework for developing, validating and deploying precision tests based on molecular profiling are depicted in Figure 1. Informatics plays a central role in the research design, modeling, model optimization and clinical deployment phases.
Figure 1.
Process for development and clinical validation of clinico-molecular profiling precision medicine tests. Blue stages: focus of present paper. Green: previously completed work. Orange and grey: future work.
The specific questions that drive our work are:
Which patients will benefit from bevacizumab?
Which patients will benefit from conventional platinum based chemotherapy?
What is the relative information value of clinical and of molecular information and how to optimally combine them?
How to create viable clinical strategies that incorporate health economics constraints so that all patients who benefit from bevacizumab will receive it, and those who do not will not burden the system?
To address these questions we develop predictive and causal models attributing treatment benefit, and predicting benefit from alternate treatment paths. Due to space limits we highlight only the most salient elements of our methodological approach.
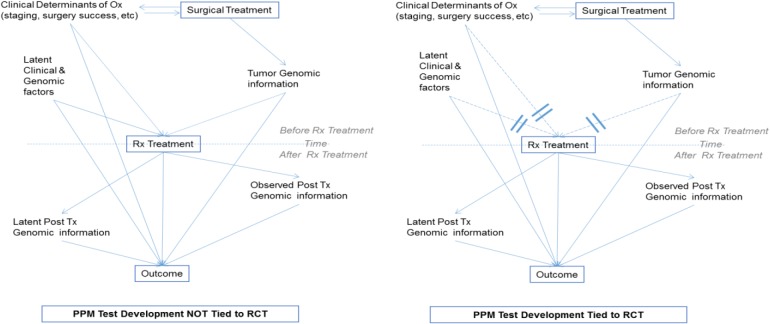
Tying modeling to Randomized Clinical Trials (RCTs) greatly facilitates estimating clinical benefits of alternative treatments. Figure 2 (right) shows the methodological benefits of tying the precision medicine tests to RCTs. In designs where treatments are not randomized (left of Figure 2) the effects of the treatment post-surgery are confounded by observed and latent (unmeasured) clinical and genomic factors. Whereas a variety of design and analytic solutions exist (including matching to known confounders, analytical control of known and suspected confounders, propensity scoring, and causal graph-based do-calculous12-14), they leave open the possibility of residual confounding (matching, analytical controls), are subject to bias (propensity scoring), are subject to undetectable latent confounding (all methods), or are not practical to apply in genome-wide scale (do-calculous)12-14. In contrast, development of the precision test based on a RCT design eliminates all confounding both from measured and latent variables. The causal effects of post-treatment factors regardless of observed or latent status are incorporated into the total estimated causal effect of the treatment variables. When factors co-determining the outcome are observed, they can be used as covariates in models that individualize the predicted effect on outcome on the basis of these measured factors.
Figure 2.
Computational modeling advantages of tying development of precision treatment tests to RCTs.
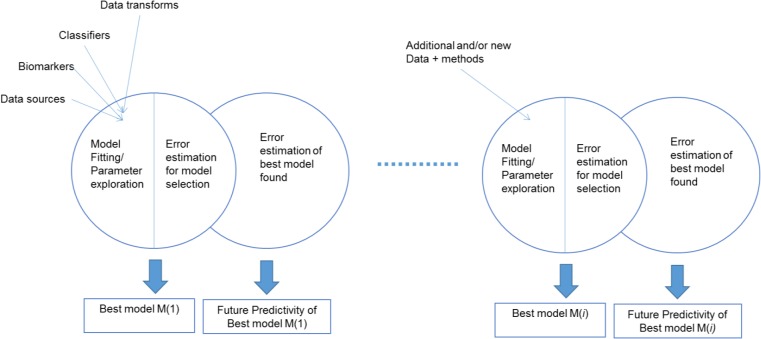
Nested N-Fold Cross-Validation (NNFCV) model selection and error estimation design (NNFCV) allows for sequential (phased) modeling without overfitting of model error estimates. The NNFCV is an established state-of-the-art design for powerful model selection and unbiased error estimation15,16. One aspect of this design that is not widely recognized is the ability to perform the analysis in stages as new data and methods become available without overfitting the error estimates of the best models. This is because in each stage of analysis the new models or data compete with the older ones against multiple internal validation tests, without ever accessing the final test set. Only after a winning model has been found, the error estimates are produced up to that round of analysis. This estimate never affects the choice of best model(s) thus avoiding overfitting. In a multi-center, multi-investigator, multi-modality, setting such as ours with data obtained in discrete stages, with evolving analytical methods, and with expanding molecular assays, the ability for ongoing, sequential analyses is very important.
Data & Specimens. Specimens and clinical data for the present study come from the OVAR-11 (German part of the ICON-7 phase III RCT)5,6. Clinical data used for analysis are: age, race, FIGO stage, histology, treatment, PFS, OS, debulking status, ECOG performance status, independent path review diagnosis and visits. Specimens were randomly allocated to RNA extraction and assay run order. In brief, 200 ng of RNA was analyzed using the Illumina Whole-Genome DASL array with the HumanRef-8 Bead Chip with 29K gene transcripts or 21K unique genes according to the manufacturer’s protocol5. Gene expression data quality was assessed via residual minus vs average plots, box plots and jitter plots, to detect experimental artifacts such as batch effects. In addition numerical measures such as stress and dfbeta, and measures of the magnitude of change due to normalization, were utilized5,10.
Classifiers and Causal effect modeling - Supervised dichotomous prediction models for PFS. We built models that predict whether patients would relapse within 12, 24, 36, 48, and 60 months from entering the trial and receiving treatment. This analysis excludes patients that dropped out before each prediction point and they were relapse negative. We used Support Vector Machines (SVMs)17,18 with polynomial kernel of degree from 1 to 3, c parameter from 0.1, 1 and 10 optimized with a nested 10-fold cross-validation (NNFCV, i.e., inner fold performing grid model selection and outer fold providing unbiased estimates of generalization error measure via ROC AUC). Features entering the analysis included: clinical variables (n=20), and gene expression microarray variables (n=29,000).
Feature selectors for binary prediction models explored: all features, Markov Boundary induction (via HITON-PC20-21 with fixed k parameter to 1), and the 106 ovarian cancer genes from the CLOVAR signature obtained by TCGA analysis and reported in prior literature11,22.
Multi-modal data combination strategies for clinical+gene expression data included: clinical only, gene expression only and clinical+gene expression in a single input vector. Feature selection and multi-modal combinations evaluation were fully nested in the NNFCV to avoid over-fitting the genes selected to the data.
Classifiers and Causal effect modeling - Time-to-event models that predict risk of relapse under different treatments and identify the patients that will benefit from bevacizumab. In these experiments we used Cox modeling23 combined with Markov Boundary induction20-21 for feature selection to model the risk for relapse as a function of treatment and of other measured possible determinants of relapse. Cox modeling uses all available information whereas dichotomous prediction at a fixed time point methods discard information due to censoring24. As explained, because the data comes from a randomized trial all possible confounders effects relating treatment and outcome are eliminating by randomization, thus the estimation of the treatment effect does not require an adjustment for confounders. The multivariate analysis separates the effect of treatment from the effect of other measured co-determinants of relapse, however. We constructed the interaction terms between potential co-determinants of relapse and the treatment. A significant interaction effect indicates a differential treatment effect for different values/levels of a co-determinant, thus results in differential treatment response from patients.
Once a model is fit, we use the model setting bevacizumab=yes as a prognostic model for the group receiving bevacizumab to estimate the outcome in that group. Similar for bevacizumab=no. We also estimate the difference between the model risk predictions for individual patients setting bevacizumab=yes and then bevacizumab=no in order to estimate the benefit of receiving bevacizumab (i.e., patients for which the estimated risk difference is negative will benefit from bevacizumab). We used 100-repeated 20-fold nested cross-validation. Treatment effects were then estimated for every subject in the testing set. We applied different threshold values on the estimated treatment effect to group people into three groups: (1) predicted to strongly benefit (2) predicted to achieve minor benefit (3) predict to not benefit. For patients in each of the three groups, we compare the actual observed benefit in terms of relapse between the treated and untreated patients. The relapse outcome was evaluated with Hazard Ratio (HR) and median survival difference between treatment and control25.
Knowledge-Driven and De Novo Feature selection for Cox modeling: we used Markov Boundary induction (GLL-PC instantiated with a Cox regression model as the conditional independent test used by the algorithm20,21; we refer to this feature selector as GLL-PC-Cox) combined with a knowledge-driven gene selection strategy as follows: we selected genes related to VEGF from the literature and pathway databases strictly based on literature support without reference to the data in hand. The following genes were selected: VEGFA VEGFR2 VEGFB VEGFC VEGFR1 VEGFR3 CLDN6 TUBB2B FGF12 MFAP2 KIF1A. In the current dataset, there are 16 probes measuring 9 of the above genes. We formed a candidate set comprising the 16 gene probes + clinical data variables and applied Markov Boundary induction on that set using Cox as a conditional independence test when performing feature selection, and then the selected features are fitted with a Cox model. All these steps are fully embedded inside the inner loop of the NNFCV design.
Results
(a) Prognostic Models (binarized time points). Models predicting Progression Free Survival (PFS) with predictivities and selected feature types/numbers are shown in Table 1. In bold are models with sufficient predictivity to be potentially clinically actionable (we operationally set a threshold of .75 AUC, representing the predictivity of state of the art FDA-approved cancer outcome and other clinically used molecular profiles).
Table 1.
Dichotomous prognostic models.
| Time point : | 12 mo | 24 mo | 36 mo | 48 mo | 60 mo | |
|---|---|---|---|---|---|---|
| Models with clinical features only | AUC | 0.71 ± 0.03 | 0.75 ± 0.03 | 0.73 ± 0.02 | 0.75 ± 0.02 | 0.71 ± 0.04 |
| # of features | 5 | 4 | 4 | 3 | 3 | |
| Models with gene expression only | AUC | 0.56 ± 0.03 | 0.58 ± 0.03 | 0.68 ± 0.03 | 0.74 ± 0.03 | 0.42 ± 0.05 |
| # of features | 149 | 153 | 222 | 215 | 94 | |
| Models with clinical + gene expression | AUC | 0.62 ± 0.02 | 0.65 ± 0.03 | 0.72 ± 0.03 | 0.77 ± 0.02 | 0.57 ± 0.03 |
| # of features | 4 + 149 | 3 + 142 | 3 + 202 | 3 + 176 | 3 + 79 | |
| Models with 106 genes from prior work (CLOVAR signature) | AUC | 0.62 ± 0.04 | 0.59 ± 0.03 | 0.62 ± 0.03 | 0.62 ± 0.02 | 0.47 ± 0.06 |
| # of features | 8 | 4 | 6 | 7 | 2 | |
As can be seen, the best models have sufficient predictivity to support for clinically actionable prognosis. The de novo feature selection clearly outperforms the predictivity of the 106 genes (CLOVAR signature) previously reported in literature (AUC=0.63). Also notably for this type of model, just 3 clinical variables achieve an AUC of .75 A slightly less predictive model can be obtained with gene expression. However the clinical variables are highly subjective e.g. residual disease after surgical cytoreduction is determined by the surgeon, which may not translate to other surgeons and they could also be manipulated or biased to favor decisions towards specific treatment options. This risk can be mitigated by using the objective and tampering-resistant gene expression models. Predictivity after 48 months drops because many patients have exited the trial at that time.
(b) Time to Event Model. The final Cox Model (complete model) is shown in Table 2. Out of 16 genes + clinical variables and their interaction with the treatment, 7 variables remained in the final model after feature selection with GLL-PC-Cox. VEGFA, MFAP2, and ECOG have a significant interaction effect with the treatment, indicating that the effects of these variables on progression free survival depends on if the treatment was administered. For example, MFAP2 show a significant main effect with coefficient of 0.23, a significant interaction with treatment with coefficient of -0.15. In the treatment group, MFAP2 have an overall coefficient of 0.23+(-0.15)*1=0.08 (HR=1.08). In the control group, MRAP2 have an overall coefficient of 0.23+(-0.15)*0=0.23 (HR=1.25).
Table 2.
Time-to-event causal effect and prognostic models.
| Variables | Coef | exp(Coef) | se exp(Coef) | z | pval |
| figo_numeric: figo stage coded as integers, 10 levels, 1 = IA, 2 = IB, ..., 9 = IIIC, and 10 = IV | 0.31 | 1.37 | 0.06 | 5.58 | 2.39E-08 |
| surg_outcome: 3 levels, -1 = suboptimal; 0 = optimal but remaining tissue smaller than 1cm; +1 = optimal or no macroscopic tissue remaining | -0.35 | 0.71 | 0.08 | -4.61 | 3.98E-06 |
| MFAP2: gene expression level of MFAP2, Microfibril Associated Protein 2, ranges from 6.7 to 15.9 with mean of 13.1 | 0.23 | 1.26 | 0.06 | 3.70 | 0.000215 |
| ECOG: ECOG performance status, 3 levels, 0 = Fully active, able to carry on all pre-disease performance without restriction; 1 = Restricted in physically strenuous activity but ambulatory and able to carry out work of a light or sedentary nature, 2 = Ambulatory and capable of all selfcare but unable to carry out any work activities; up and about more than 50% of waking hours. | 0.48 | 1.61 | 0.14 | 3.34 | 0.000851 |
| VEGFAxrndid VEGFA: gene expression level of MFAP2, Vascular Endothelial Growth Factor A, ranges from 4.9 to 13.3 with mean of 10.5 Rndid: 1= bevacizumab+Carboplatin; 0=Carboplatin. VEGFAxrndid, MFAP2xrndid,ECOGxrndid indicate interaction effects. | 0.19 | 1.20 | 0.07 | 2.76 | 0.005818 |
| MFAP2xrndid | -0.15 | 0.86 | 0.05 | -2.83 | 0.004651 |
| ECOGxrndid | -0.44 | 0.64 | 0.19 | -2.26 | 0.023707 |
| Concordance= 0.693 (se = 0.019 ), Rsquare= 0.281 (max possible= 0.999 ), Likelihood ratio test= 125.2 on 7 df, p=0, Wald test= 97.88 on 7 df, p=0, and Score (logrank) test = 108.7 on 7 df, p=0. | |||||
(c) Identifying subpopulations who benefit from bevacizumab. By exploring different thresholds on the PFS risk produced by the Cox models, we can identify individual patients and subpopulations that will benefit the most, the least, and in between. Table 3 shows examples of subpopulation identification.
Table 3.
Examples of using the Cox models to identify patient subgroups that will benefit the most and the least from bevacizumab.

|
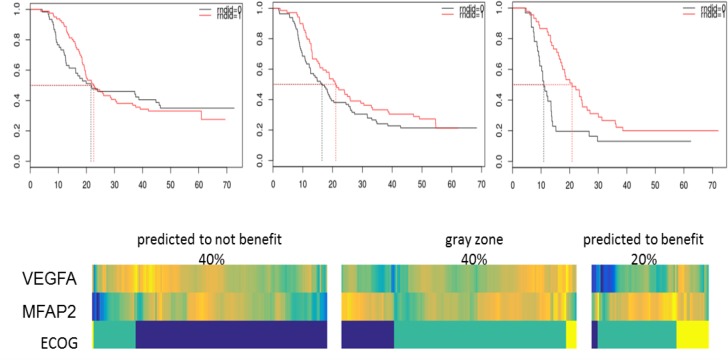
For example, the second row (grey background) depicts separation of a subgroup equal to 20% of the total patient population that will benefit approx. 10 months for survival, or on the other end a subgroup equal to 40% of the total population without benefit (nominal benefit of 1.3 months which is not statistically significant). Figure 4 depicts Kaplan-Meier curves (top) and heatmaps (bottom) corresponding to these subgroups and predictor variables in the reduced model, identifying patients and subgroups that will benefit the most or the least from bevacizumab. Patients that benefit more from the addition of bevacizumab have lower expression level of VEGF-A, higher expression level of MFAP2 and worse EGOC performance status. Each column indicates a patient. Yellow color indicates higher value, green intermediate value and blue indicates lower value. All variables are scaled between 0 to 1 to assist visualization.
Figure 4:
Kaplan-Meier curves (top) and heatmaps (bottom) corresponding to subgroups and predictor variables in the reduced model identifying patients and subgroups that will benefit the most or the least from bevacizumab.
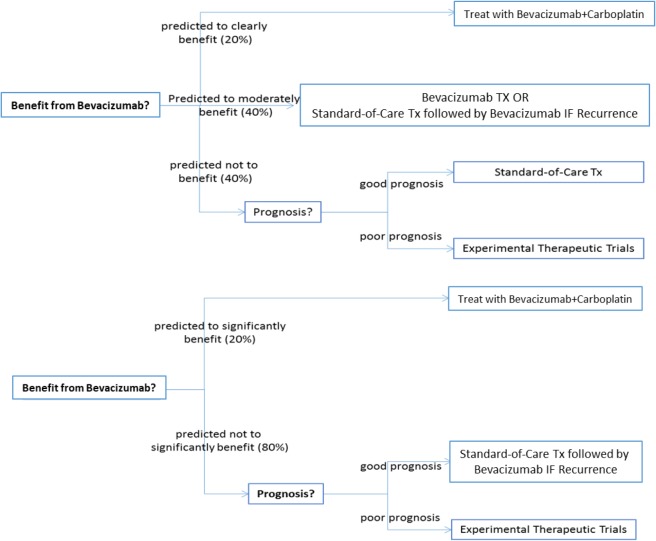
(d) Construction of Treatment Strategies. By using the above analytical models we can construct and evaluate clinical treatment strategies. Two example strategies are depicted in Figure 5. The top strategy identifies a “clear benefit” group that should receive bevacizumab, a “no benefit” group that should receive standard treatment if the dichotomous prognosis models predict good response to Carboplatin or should be routed to experimental therapeutics if predicted response is not good. An intermediate group with “minor/questionable benefit” from bevacizumab may receive standard care plus bevacizumab in case of recurrence. An alternative binary strategy is depicted in the lower bottom of Figure 5 where the “no benefit” and “minor/questionable benefit” groups have been merged.
Figure 5:
Example of clinical strategies utilizing precision treatment models/tests. Top: benefit-questionable benefit-no benefit subgroups. Bottom: benefit-no/questionable benefit subgroups.
Health Economic Aspects
The next generation of targeted molecular drugs have huge potential to save lives and improve quality of life but come at an increasingly prohibitive cost. At the same time most of the drugs do not benefit all patients alike and some cases, such as bevacizumab, many patients will not benefit at all. This creates a situation where many patients that will benefit the most may not receive the drug and vice versa especially as private payers and national health systems are reluctant to approve or pay for drugs with so wide a therapeutic effect range . Precision medicine offers a rational and evidence-driven approach to allocating scarce heath system resources to the patients who will benefit the most, reducing health disparities and increasing length and quality of life in a finite resource setting to the full extent possible.
In a comprehensive study of the cost effectiveness of alternative strategies of using bevacizumab as primary treatment for ovarian cancer, Barnett et al showed via mathematical modeling that a postulated predictive model for benefit from bevacizumab would provide a dominant bevacizumab treatment strategy7. While at that time such a model did not exist, our present work introduces precisely such a model.
Table 4 summarizes the potential for health economic impact of a precision test based on the predictivity of our models and corresponding clinical strategies outlined in this paper when treating all patients with bevacizumab is compared to treating only the group predicted to benefit the most. Table 4 also summarizes other cost savings/economic impact on the R&D side of things (specifically the economic impact of feature selection for reducing the discovery model to a deployment model and costs saved by tying the precision medicine test development to pre-existing RCTs). As can be seen, use of the discovered model reported here can save the health system over a projected 10yr lifetime of bevacizumab, a maximum of $30B globally without significant loss of survival/QULY benefit for individual patients.
Table 4.
Summary economic impact of precision tests, of data analytics and of coupling R&D to RCTs.
| Estimated health economic impact of deploying PPM test across the health system-treating all patients with bevacizumab compared to treating only the group predicted to strongly benefit |
| $30 Billion savings over a 10 year horizon. Assumptions: 50,000 patients annually globally. All patients receive precision medicine test (approx. cost of $2,000/test) but only 20% of patients identified to benefit receive bevacizumab. Cost of bevacizumab/patient is $60,000. Baseline comparison: all patients receive bevacizumab. |
| Incremental cost-effectiveness ratio (ICER) |
|
| Time acceleration and R&D Economic impact of RCT tie for development of PPM test |
|
| Economic impact of feature selection to deployment costs of PPM test |
|
The Incremental Cost-Effectiveness Ratio of the precision medicine-based treatment with bevacizumab is $120,000 per QALY, which renders it a dominant bevacizumab treatment strategy and may also be acceptable in a variety of willingness-to-pay threshold settings. The test can thus justify reimbursement for patients who do benefit for the drug and can induce payers to cover the medical expenses for those who will benefit. Finally the test can route the patients who will not benefit from either conventional or bevacizumab treatment to alternative experimental treatments with additional life and economic benefits.
Conclusions and Future Work
The computational models reported here support a precision test with sufficient predictivity to guide tailored patient treatment decisions with bevacizumab for ovarian cancer patients, reducing healthcare system costs dramatically over the span of 10 years and making affordable the use of this treatment on the health system level without significant loss of length or quality of life for patients. The Incremental Cost-Effectiveness Ratio of the precision medicine-based treatment with bevacizumab according to the analysis of Barnett et al7 renders it a dominant bevacizumab treatment strategy.
Informatics and data science plays a critical role in the development of precision medicine tests and is most effective when guided by and supporting driving clinical and health economic requirements as illustrated by the present study. The research design choice of connecting development of precision medicine tests to RCTs yields extraordinary cost, speed and scientific validity benefits. This model for Personalized and Precision Medicine (PPM) R&D is highly generalizable and scalable. It should thus be considered as a high priority design for similar precision medicine development efforts.
Our ongoing work involves adding several more assays (450K methylation arrays – already completed; medical exome sequencing and NanoString miRNA expression assays – work in progress, single-cell assays and informatics) in an effort to further increase predictivity before finalizing the precision test model. Once this next stage is completed, we intend to validate the final test in patient data/samples from three completed phase III clinical trials (n=1943) testing the addition of bevacizumab to platinum based chemotherapy.
Figure 3.
Sequential Nested N-Fold Cross-Validation model selection and error estimation design (NNFCV) used for overfitting-resistant multi-stage analysis as new methods, and data become available.
Acknowledgments
The following funding sources are acknowledged: Mayo Clinic SPORE in ovarian cancer (P50 CA136393), Mayo Clinic Comprehensive Cancer Center grant (P30 CA015083), National Institutes of Health Award Number UL1TR000114 to the UMN CTSI, UMN Masonic Cancer Center grant NIH P30 CA77598, UMN “Grand Challenges“ grant “Development Of A Clinical Precision Medicine Program In Ovarian Cancer As A Paradigm For 21st Century Tailored-Health Care Solution”. The ICON-7 trial was Supported by Roche and the National Institute for Health Research, through the National Cancer Research Network.
References
- 1.Cancer Facts & Figures 2016 | American Cancer Society [Internet] [cited 2018 Mar 7]. Available from: https://www.cancer.org/research/cancer-facts-statistics/all-cancer-facts-figures/cancer-facts-figures-2016.html.
- 2.Barnholtz-Sloan JS, Schwartz AG, Qureshi F, Jacques S, Malone J, Munkarah AR. Ovarian cancer: changes in patterns at diagnosis and relative survival over the last three decades. Am J Obstet Gynecol. 2003 Oct;189(4):1120–7. doi: 10.1067/s0002-9378(03)00579-9. [DOI] [PubMed] [Google Scholar]
- 3.Friedlander ML, Stockler MR, Butow P, King MT, McAlpine J, Tinker A, et al. Clinical Trials of Palliative Chemotherapy in Platinum-Resistant or -Refractory Ovarian Cancer: Time to Think Differently? J Clin Oncol. 2013 Jun 20;31(18):2362–2362. doi: 10.1200/JCO.2012.47.7927. [DOI] [PubMed] [Google Scholar]
- 4.Baker VV. Salvage therapy for recurrent epithelial ovarian cancer. Hematol Oncol Clin North Am. 2003 Aug;17(4):977–88. doi: 10.1016/s0889-8588(03)00057-1. [DOI] [PubMed] [Google Scholar]
- 5.Kommoss S, Winterhoff B, Oberg AL, Konecny GE, Wang C, Riska SM, et al. bevacizumab May Differentially Improve Ovarian Cancer Outcome in Patients with Proliferative and Mesenchymal Molecular Subtypes. Clin Cancer Res Off J Am Assoc Cancer Res. 2017 Jul 15;23(14):3794–801. doi: 10.1158/1078-0432.CCR-16-2196. [DOI] [PMC free article] [PubMed] [Google Scholar]
- 6.Perren TJ, Swart AM, Pfisterer J, Ledermann JA, Pujade-Lauraine E, Kristensen G, et al. A Phase 3 Trial of bevacizumab in Ovarian Cancer. N Engl J Med. 2011 Dec 29;365(26):2484–96. doi: 10.1056/NEJMoa1103799. [DOI] [PubMed] [Google Scholar]
- 7.Barnett JC, Alvarez Secord A, Cohn DE, Leath CA, Myers ER, Havrilesky LJ. Cost effectiveness of alternative strategies for incorporating bevacizumab into the primary treatment of ovarian cancer. Cancer. 2013 Oct 15;119(20):3653–61. doi: 10.1002/cncr.28283. [DOI] [PubMed] [Google Scholar]
- 8.Cancer Genome Atlas Research Network. Integrated genomic analyses of ovarian carcinoma. Nature. 2011 Jun 29;474(7353):609–15. doi: 10.1038/nature10166. [DOI] [PMC free article] [PubMed] [Google Scholar]
- 9.Tothill RW, Tinker AV, George J, Brown R, Fox SB, Lade S, et al. Novel molecular subtypes of serous and endometrioid ovarian cancer linked to clinical outcome. Clin Cancer Res Off J Am Assoc Cancer Res. 2008 Aug 15;14(16):5198–208. doi: 10.1158/1078-0432.CCR-08-0196. [DOI] [PubMed] [Google Scholar]
- 10.Winterhoff B, Hamidi H, Wang C, Kalli KR, Fridley BL, Dering J, et al. Molecular classification of high grade endometrioid and clear cell ovarian cancer using TCGA gene expression signatures. Gynecol Oncol. 2016 Apr;141(1):95–100. doi: 10.1016/j.ygyno.2016.02.023. [DOI] [PMC free article] [PubMed] [Google Scholar]
- 11.Konecny GE, Wang C, Hamidi H, Winterhoff B, Kalli KR, Dering J, et al. Prognostic and therapeutic relevance of molecular subtypes in high-grade serous ovarian cancer. J Natl Cancer Inst. 2014 Oct;106(10) doi: 10.1093/jnci/dju249. [DOI] [PMC free article] [PubMed] [Google Scholar]
- 12.Pearl J. Cambridge University Press; 2009. Causality; p. 486. [Google Scholar]
- 13.Rosenbaum PR, Rubin DB. The central role of the propensity score in observational studies for causal effects. Biometrika. 1983 Apr 1;70(1):41–55. [Google Scholar]
- 14.Rosenbaum PR, Rubin DB. Constructing a Control Group Using Multivariate Matched Sampling Methods That Incorporate the Propensity Score. Am Stat. 1985 Feb 1;39(1):33–8. [Google Scholar]
- 15.Statnikov A. 2011. A Gentle Introduction to Support Vector Machines in Biomedicine: Theory and methods. World Scientific; p. 200. [Google Scholar]
- 16.Duda RO, Hart PE, Stork DG. John Wiley & Sons; 2012. Pattern Classification; p. 679. [Google Scholar]
- 17.Vapnik V. 2nd ed. New York: Springer-Verlag; 2000. The Nature of Statistical Learning Theory [Internet] cited 2018 Mar 8]. (Information Science and Statistics). Available from: //www.springer.com/us/book/9780387987804. [Google Scholar]
- 18.Boser BE, Guyon IM, Vapnik VN. New York NY, USA: ACM; 1992. A Training Algorithm for Optimal Margin Classifiers. In: Proceedings of the Fifth Annual Workshop on Computational Learning Theory [Internet] [cited 2018 Mar 8] 144–152 (COLT ‘92). Available from: http://doi.acm.org/10.1145/130385.130401. [Google Scholar]
- 19.Aliferis CF, Tsamardinos I, Statnikov A. 2003. HITON: A Novel Markov Blanket Algorithm for Optimal Variable Selection. AMIA Annu Symp Proc 2003; pp. 21–5. [PMC free article] [PubMed] [Google Scholar]
- 20.Aliferis CF, Statnikov A, Tsamardinos I, Mani S, Koutsoukos XD. Local causal and markov blanket induction for causal discovery and feature selection for classification part i: Algorithms and empirical evaluation. J Mach Learn Res. 2010 (Jan)11:171–234. [Google Scholar]
- 21.Aliferis CF, Statnikov A, Tsamardinos I, Mani S, Koutsoukos XD. Local causal and markov blanket induction for causal discovery and feature selection for classification part ii: Analysis and extensions. J Mach Learn Res. 2010 (Jan)11:235–284. [Google Scholar]
- 22.Verhaak RGW, Tamayo P, J-Y Yang, Hubbard D, Zhang H, Creighton CJ, et al. Prognostically relevant gene signatures of high-grade serous ovarian carcinoma. J Clin Invest. 2013 Jan;123(1):517–25. doi: 10.1172/JCI65833. [DOI] [PMC free article] [PubMed] [Google Scholar]
- 23.Cox DR. New York NY: Springer; 1992. Regression Models and Life-Tables. In: Breakthroughs in Statistics [Internet] [cited 2018 Mar 8] 527–41 (Springer Series in Statistics). Available from: https://link.springer.com/chapter/10.1007/978-1-4612-4380-9_37. [Google Scholar]
- 24.Efron B. The Efficiency of Cox’s Likelihood Function for Censored Data. J Am Stat Assoc. 1977 Sep 1;72(359):557–65. [Google Scholar]
- 25.Clark TG, Bradburn MJ, Love SB, Altaian DG. Survival Analysis Part I: Basic concepts and first analyses. Br J Cancer. 2003 Jul;89(2):232–8. doi: 10.1038/sj.bjc.6601118. [DOI] [PMC free article] [PubMed] [Google Scholar]
- 26.Harrell F. 2nd ed. Springer International Publishing; 2015. Regression Modeling Strategies: With Applications to Linear Models Logistic and Ordinal Regression and Survival Analysis [Internet] [cited 2018 Mar 8]. (Springer Series in Statistics). Available from: //www.springer.com/us/book/9783319194240//www.springer.com/us/book/9783319194240. [Google Scholar]


