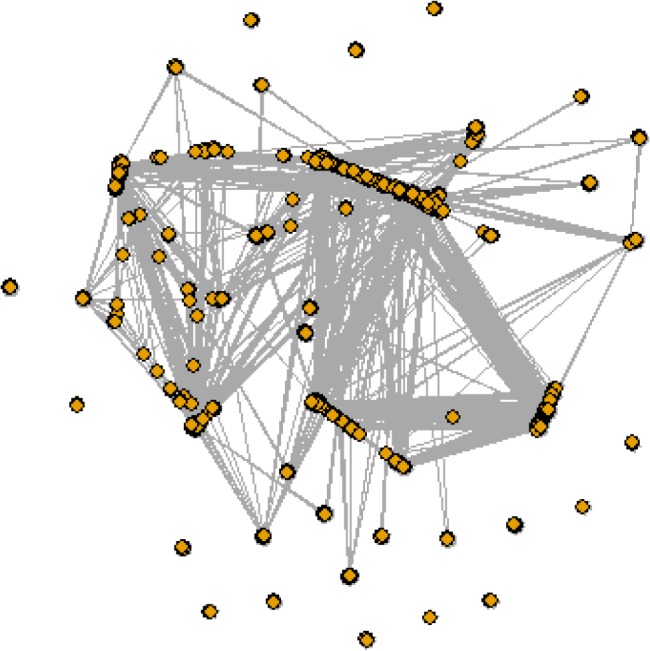
Figure 1.

Network of healthcare providers for patients with diabetes in Year1. Node represent the healthcare providers and edges between them represent the patients shared among the healthcare providers. Thicker edges show stronger relationships in other words larger number of patient shared.
