Fig 4.

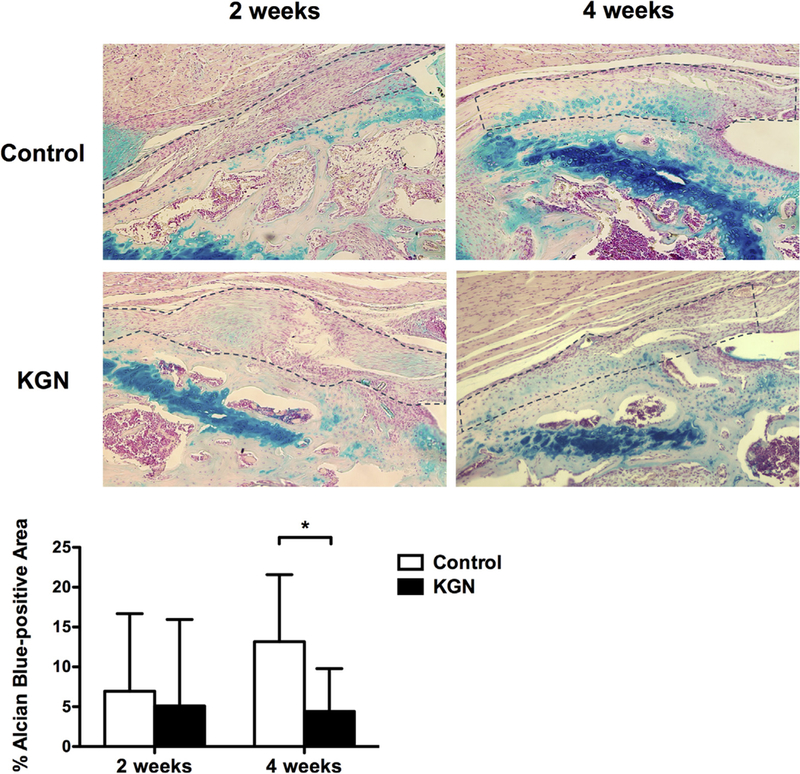
Percentage of Alcian blue-positive areas within the tendon-bone interface for the control and kartogenin (KGN) groups (original magnification ×10). Area outlined by the dotted line represents the tendon-bone interface. *P = .04.

Percentage of Alcian blue-positive areas within the tendon-bone interface for the control and kartogenin (KGN) groups (original magnification ×10). Area outlined by the dotted line represents the tendon-bone interface. *P = .04.