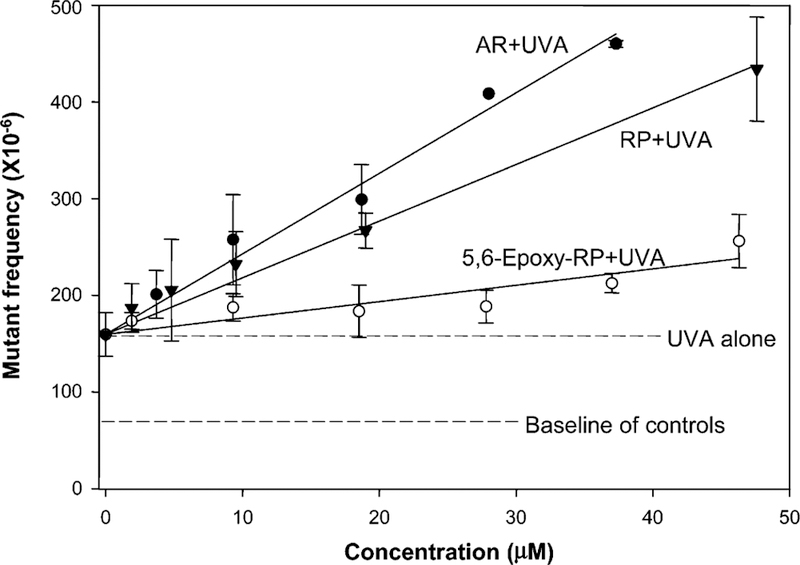
Figure 2.

Comparison of photomutagenicity of RP (▼), AR (●), and 5,6-epoxy-RP (O) in mouse lymphoma cells. The cells were treated with different concentrations of compounds in conjunction with UVA irradiation of 2.48 J/cm2 (1.38 mW/cm2 for 30 min). The data points for AR + UVA and 5,6-epoxy-RP + UVA represent the mean of two independent experiments from Table 1. The RP + UVA data were from our previous results (19). UVA alone was the mean of mutant frequencies generated from all experiments with UVA treatment alone. The data for RP, AR, and 5,6-epoxy-RP were adjusted according to the mean of UVA alone as the origin of regression lines.
