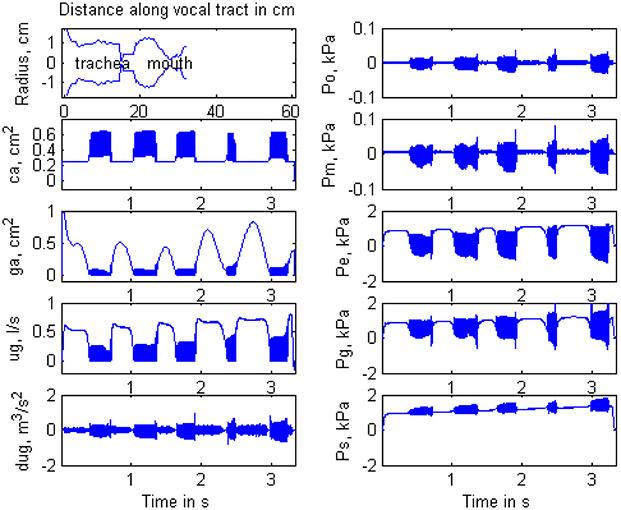
Figure 7.
Waveform outputs of the simulator. Left column: vocal tract outline, contact area, glottal area ga, flow ug, flow derivative dug. Right column: pressure out Po, pressure behind lips Pm, pressure at epiglottis Pe, pressure at glottis Pg, and subglottal pressure Ps. The upper right is the pressure at the mouth which can be played back as simulated voice (compare to row one of Figure 6).

