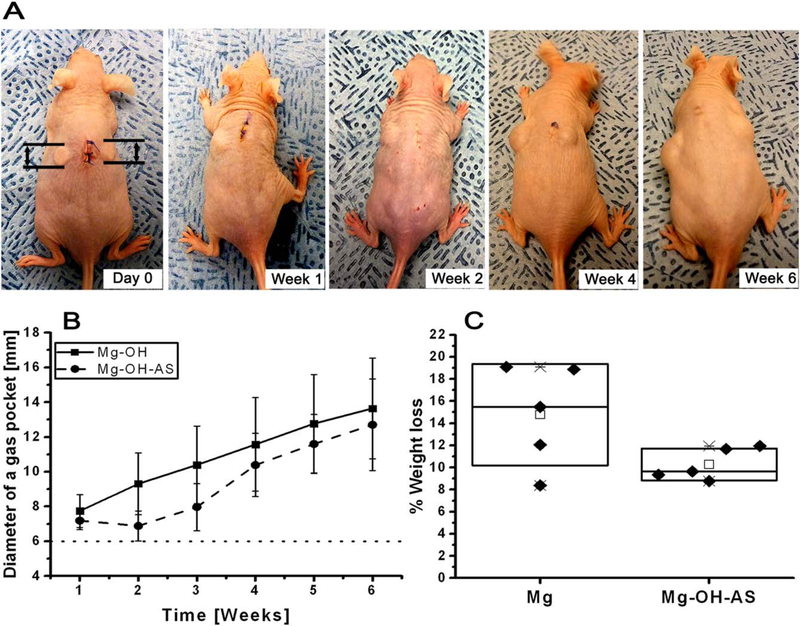
FIGURE 2.
(A) Photographs of a mouse at different time points after implantation of noncoated (left side) and AS coated (right side) Mg discs. Dotted line indicates the diameter of the implanted Mg disc. (B) Changes in the diameter of the gas pockets around the AS coated (circle) and noncoated (square) Mg discs and (C) % weight loss of Mg discs implanted in vivo for 6 weeks. For Box plot C, the diamonds (◆) represent individual values. The median values of are represented by horizontal lines inside the box; the mean values are represented by the empty rectangle (□); the upper and lower box ranges represent standard deviation (SD).

