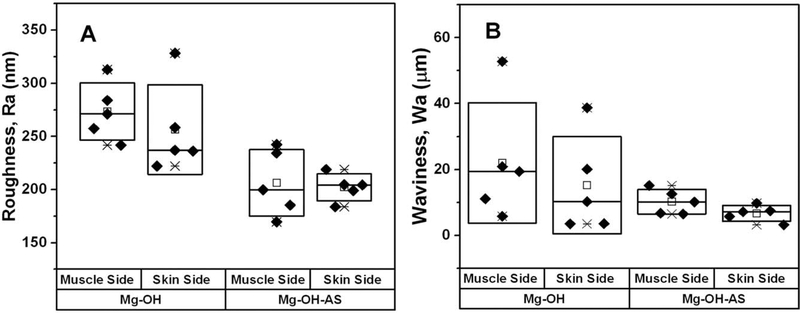
FIGURE 4.
Box plots of (A) roughness (Ra) and (B) waviness (Wa) data of the samples implanted for 6 weeks after the implantation. The diamonds (◆) represent individual values from individual samples. The median values are represented by horizontal lines in the center of the box; the mean values are represented by the empty rectangle (□) on the box plot; the upper and lower box ranges represent standard deviation (SD).

