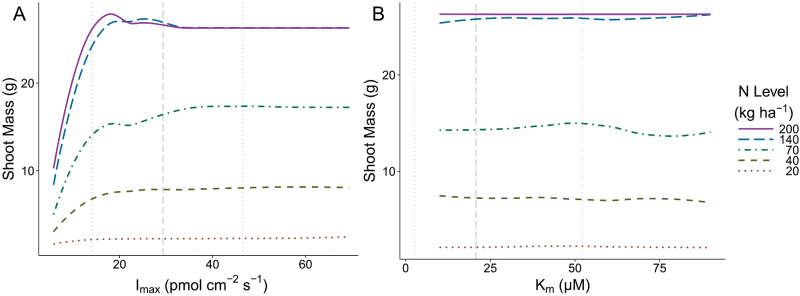
Fig. 4.
In order to conduct I max sensitivity analysis (A) and K m sensitivity analysis (B) on shoot growth, maize plants were simulated with a range of nine parameter values growing in soils at five nitrogen levels using SimRoot. The line type indicates the nitrogen level in which the simulations grew and are smoothed with loess for ease of interpretation. Vertical dashed lines indicate the minimum, average, and maximum values from the empirical study.

