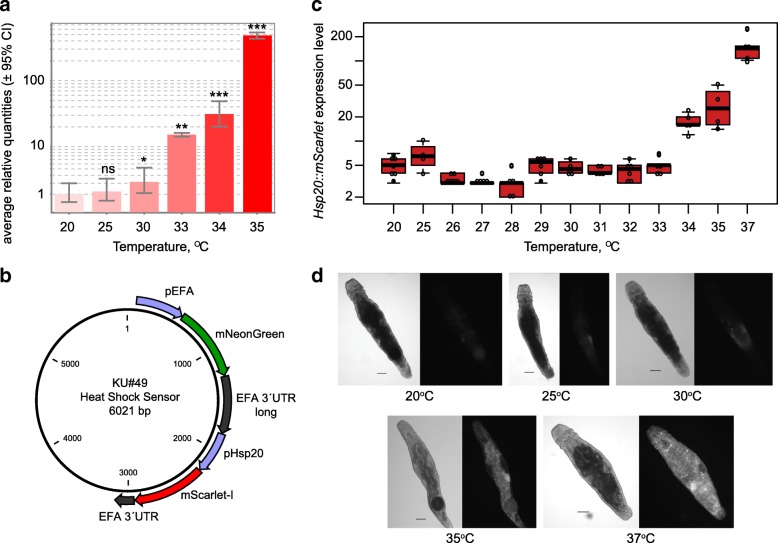
Fig. 2.
Heat shock response in M. lignano a qRT-PCR analysis of Mlig-hsp20 gene expression at different temperatures. The graph is normalized to the expression levels at 20 °C. Statistical significance of the changes relative to the 20 °C condition is calculated using t-test. ns, P > 0.05; *, P ≤ 0.05; **, P ≤ 0.01; ***, P ≤ 0.001. Three biological replicates were used for each condition. Error bars indicate 95% confidence intervals b Structure of the transgenic heat shock sensor construct KU#49. Promoter of a heat shock responsive gene Mlig-hsp20 gene drives expression of mScarlet-I, and promoter of the ubiquitously expressed gene Mlig-EFA drives expression of mNeonGreen and is used as a positive selection marker for transgenesis. c Fluorescence intensity of hsp20::mScarlet transgene expression at different temperatures. d Example images of NL28 transgenic animals used for measuring hsp20::mScarlet transgene expression. DIC and dsRed channels are shown for each temperature. Scale bars are 100 μm

