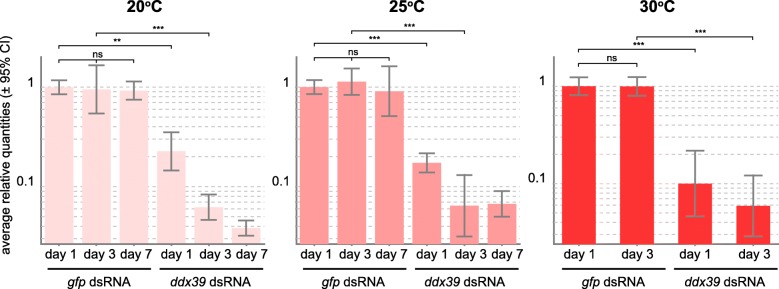
Fig. 6.
Levels of Mlig-ddx39 gene expression at different temperatures and durations of treatment with Mlig-ddx39 dsRNA measured by qRT-PCR. Treatment with dsRNA against gfp was used as a control, and the graphs are normalized to the expression levels of Mlig-ddx39 at day 1 in control treated animals at a given temperature. Statistical significance of the changes is calculated using t-test. ns, P > 0.05; *, P ≤ 0.05; **, P ≤ 0.01; ***, P ≤ 0.001. Three biological replicates were used for each condition. Error bars indicate 95% confidence intervals. No measurements were performed at day 7 at 30 °C since nearly all Mlig-ddx-39-treated animals were dead by this time

