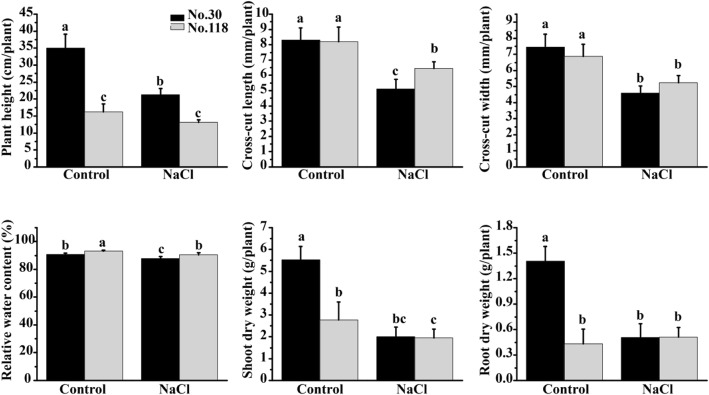
Fig. 1.
Morphological trait performance of two eggplant genotypes measured under control and salt conditions. The cross-cut length and width represent stem development. Bars represent means ± SD of three biological replicates. Columns with different letters indicate significant differences at P < 0.05 (Duncan’s test)

