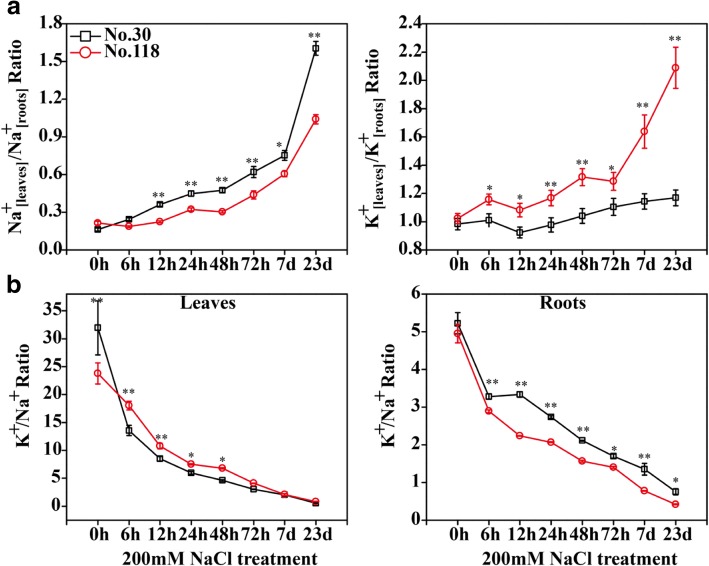
Fig. 2.
The distribution of Na+ and K+ and the change of K+/Na+ ratio in leaves/roots of two eggplant genotypes along with salt treatment. a The distribution of Na+ and K+ in leaves and roots. b The change of K+/Na+ ratio in leaves and roots. Three replicates were used in each time point, with three seedlings per replicate. Bars represent means ± SD of three biological replicates. Duncan’s Multiple Range test (*P < 0.05 and **P < 0.01) was used to analyze statistical significance

