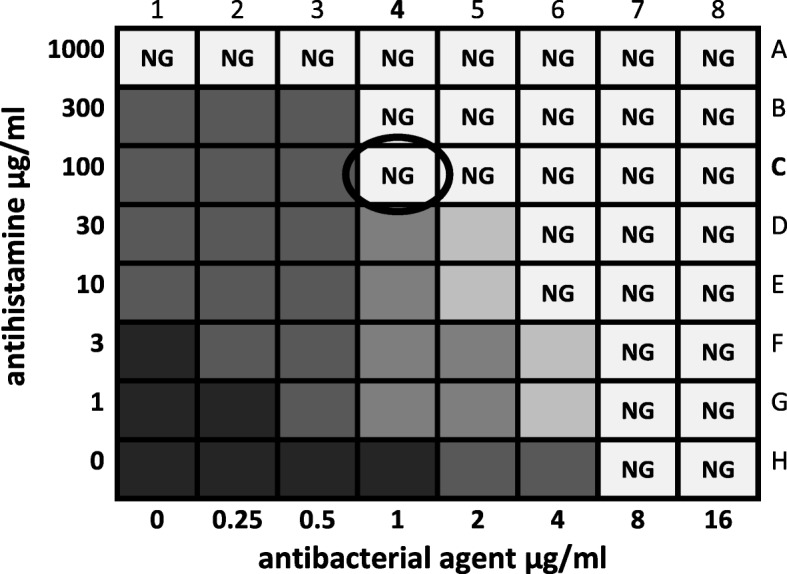
Fig. 2.

Schematic explanation of a checkerboard experiment in a 96-multiwell-plate. This example shows an enhanced efficacy of two drug combinations. The antibacterial agent is applied along the columns and the antihistamine along the rows, both in increasing concentrations. The decrease of bacterial growth is presented schematically by fading shades of gray. “NG” indicates no growth of bacteria. In this example, the effect of the antibacterial agent is enhanced in well C4 (circled)
