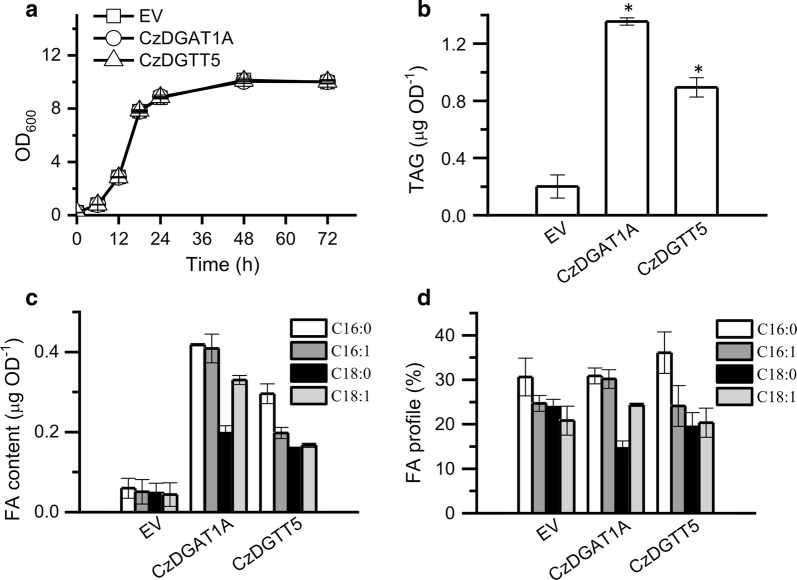
Fig. 6.
Overexpression of CzDGAT1A and CzDGTT5 each in the yeast strain S. cerevisiae INVSc1. a Growth curve. b TAG content. c Fatty acid content of TAG. d Fatty acid percentage of TAG. The data were obtained from 48-h cultures and are expressed as mean ± SD (n = 3). Asterisks indicate the significant difference compared to EV (t-test, P < 0.01)

