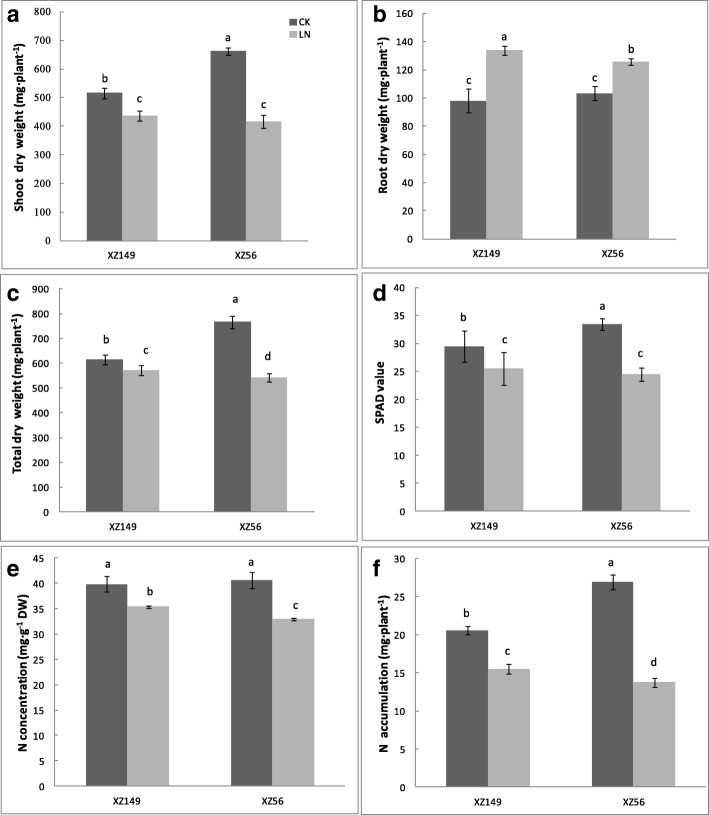
Fig. 1.
Growth performances of the two wild barley genotypes at 12 d after low N stress. a Shoot dry weight (n = 6); b Root dry weight (n = 6); c Total dry weight (n = 6); (d) SPAD value (n = 10); e N concentration (n = 3); f N accumulation (n = 6). CK: Normal N level (2 mM N); LN: Low N level (0.2 mM N); DW: dry weight. The different letters mean significant difference among treatments and genotypes according to the Duncan’s multiple range, P < 0.05

