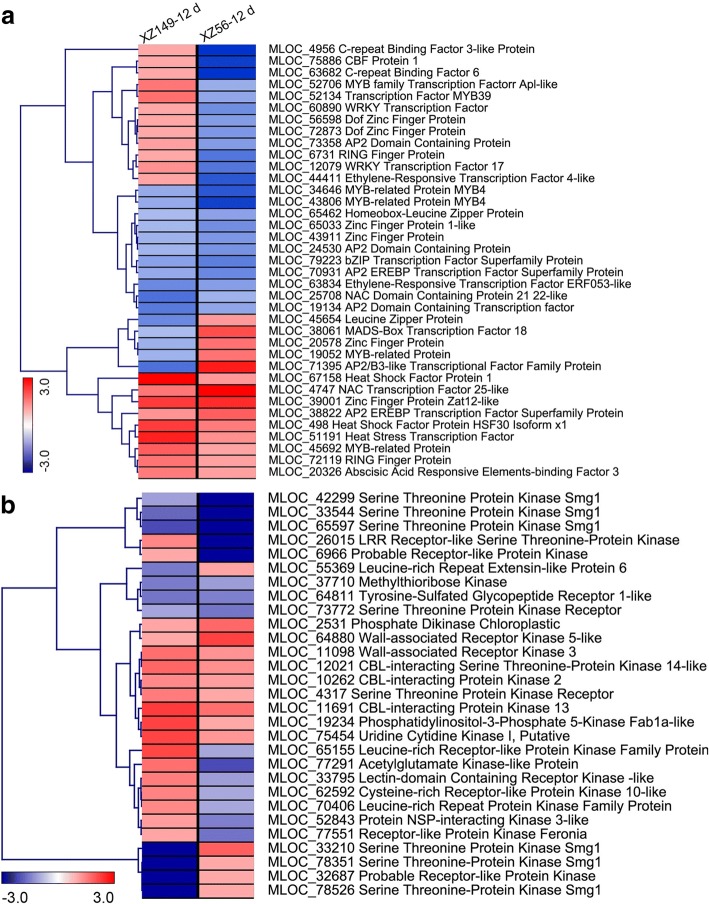
Fig. 5.
Average linkage hierarchical cluster analysis of transcription factors (TFs) and protein kinases (PKs) identified in differentially expressed genes (DEGs). a Transcription factors (TFs); b Protein kinases (PKs). The samples and treatments are displayed above each column. Genes are displayed by different colors. Relative levels of expression are showed by a color gradient from low (blue) to high (red)

