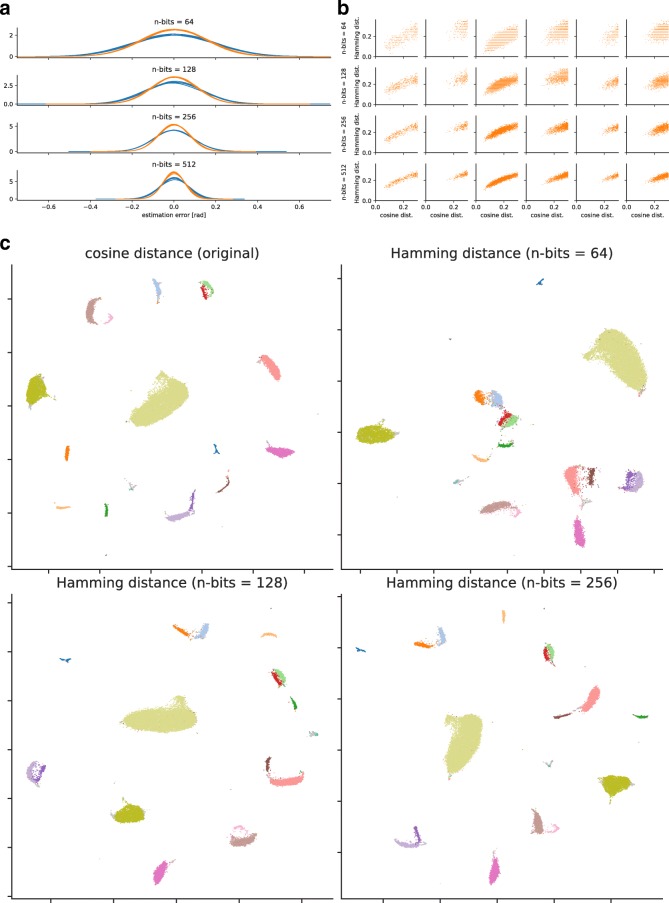
Fig. 3.
Locality-sensitive hashing of expression profiles (Shekhar2016). a Distributions of estimation errors for angles. The blue lines show the distributions without orthogonalization, and the orange lines show the distributions with orthogonalization. Five hash values were generated independently, and their estimation errors in radian were computed for 100 cells randomly sampled from Shekhar2016. b Scatter plots of the Hamming distance versus the cosine distance. The rows are four different bit lengths (64, 128, 256, and 512 bits) and the columns are six cells randomly sampled from Shekhar2016. The Hamming distance is normalized to [0,1] for comparison across different bit lengths, and the cosine distance is truncated at 0.3 for brevity. c Two-dimensional embedding of expression profiles with UMAP. The upper-left plot was derived from the cosine distances following dimensionality reduction. The other three plots were derived from the Hamming distances after hashing with 64, 128, and 256 bits. Colors indicate the annotations (18 cell types and doublets/contaminants) of Shekhar2016

