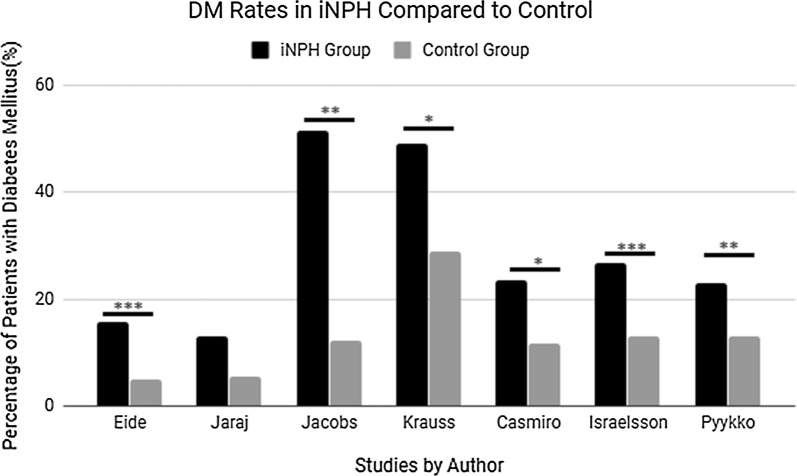
Fig. 1.
DM rates in iNPH group compared to control. The percentage of patients in each case controlled study presenting with DM in either the iNPH group or the study’s control group (varying by study). Number of patients in each group: N iNPH, C control. Eide: N-440, C-43,387, Jaraj: N-26, C-130, Jacobs: N-33, Kraus: N-63, C-70, Casmiro: N-4, C-2 Israelsson: N: 38, C-44, Pyykko: N-283, C-253. Studies indicated with a “*” had statistically significant results P < .05, “**” = P < .01, “***” = P < .001 (error bars were unavailable for the above studies)

