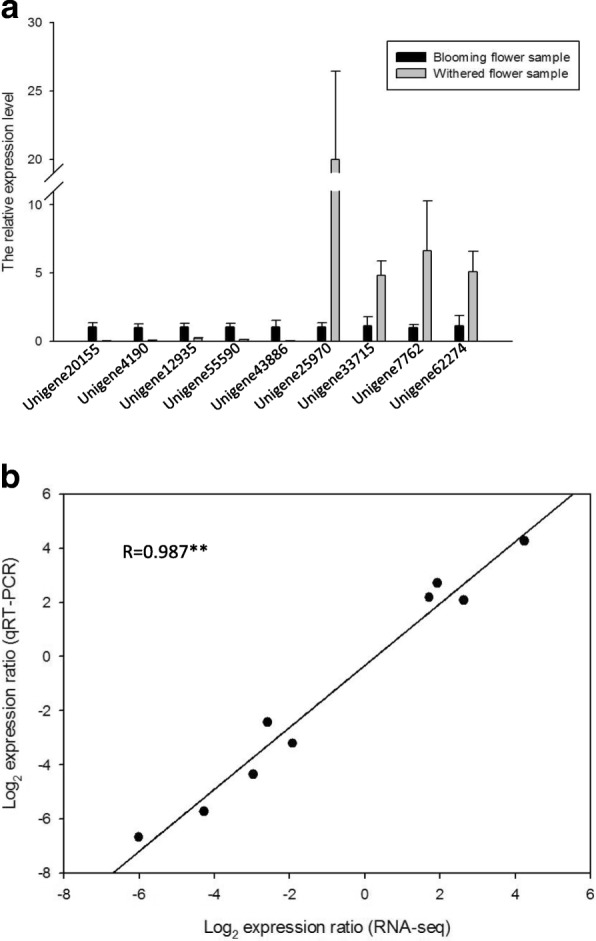
Fig. 6.

qRT-PCR validation of differential expressed unigenes. a. The expression of nine randomly selected unigenes was analyzed by qRT-PCR. The data represent the means and standard errors from three biological replicates. b. Correlation analysis of the gene expression ratios calculated from the qRT-PCR and RNA-seq data. The qRT-PCR log2 values (y-axis) were plotted against the RNA-seq log2 values (x-axis). The asterisks on the correlation coefficient (R) indicates the highly significant difference at P <0.01
