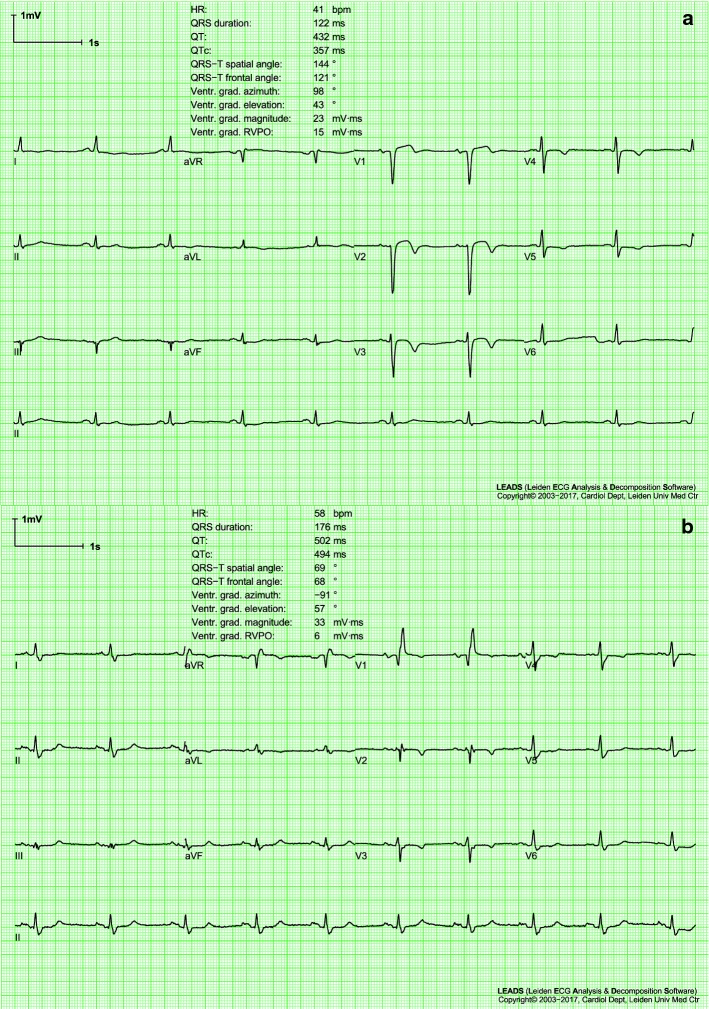
Fig. 1.
Two electrocardiograms (ECGs) of a case patient from the heart failure database (HFDB). The first ECG was made at baseline (a) and the second during follow-up (b). Both ECGs are standard 10-s 12-lead ECGs displayed according to the standard ECG display format. For each panel, the upper three traces show, multiplexed, 2.5 s of the four lead groups I/II/III, aVR/aVL/aVF, V1/V2/V3 and V4/V5/V6; instead, the longer trace displays continuously lead II, specifically used for rhythm analysis. A selection of measurements made by the LEADS program [13] is displayed in the upper part of each ECG page. See text for the clinical context and interpretation of these ECGs

