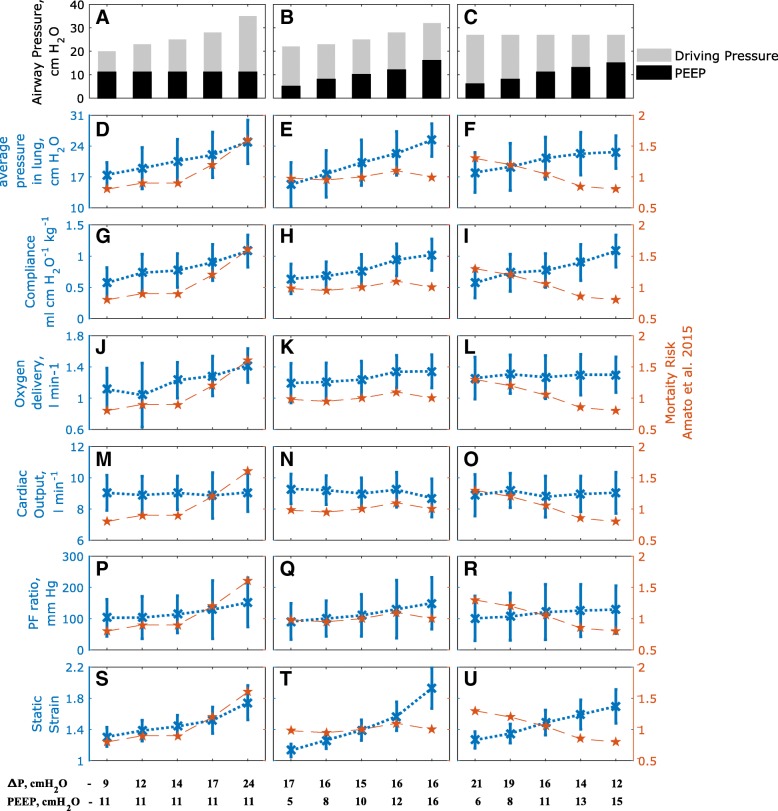
Fig. 3.
Results of changing driving pressure and PEEP (a-c) on alveolar pressure (d-f), dynamic compliance (g-i), peripheral oxygen delivery (j-l), cardiac output (m-o), PF ratio (p-r) and static strain (s-u). Subplots (d-u) also indicate the mortality risk rates (red) published in Amato et al. [12] for corresponding changes in airway pressure (subplots a–c and listed at the foot of the figure). Blue crosses show mean values in the population and the error bars represent 1 standard deviation

