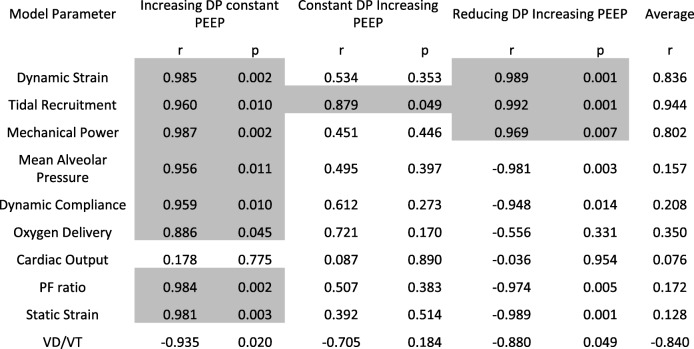
Table 2.
Correlation coefficients of outputs with respect to mortality data
The table reports the Pearson linear correlation coefficient (r) between the simulated outputs and mortality data reported in 12, with corresponding p value using the students t distribution. Shaded areas highlight parameters with strong positive and significant correlations with mortality data (r > 0.85, p < 0.05). Table ordered in descending order for average r. PF ratio is the ratio of arterial oxygen tension to fraction of O2 in inspired air. VD/VT is the physiological deadspace fraction

