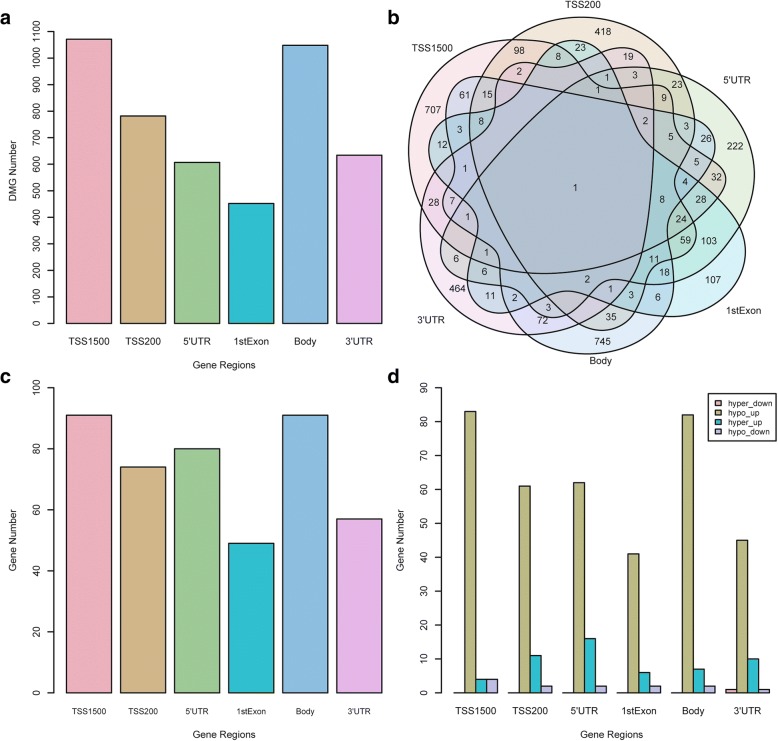
Fig. 3.
Integration analysis results of DMGs based on different region CpGs and DEGs. a Barplot for different region DMGs. The y-axis is the number of DMGs. The x-axis labels different gene regions: TSS1500, TSS200, 5′UTR, 1stExon, body, and 3′UTR. TSS1500 refers to 200–1500 bases upstream of the transcriptional start site (TSS). TSS200 means 0–200 bases upstream of TSS. 5′UTR stands for the 5′ untranslated region located between the TSS and the ATG start site. 1stExon is short for the first exon of the gene. Body is the region between ATG start site and stop codon. 3′UTR is short for 3′ untranslated region that is between stop codon and poly-A tail. b Venn plot for different region DMGs. The numbers on the diagram represent the DMG numbers in a specific region or multiple regions. Each region name is labeled beside the region circle. c Barplot for the overlap genes between DEG and different region DMGs. The y-axis is the number of overlap genes. The x-axis labels different gene regions: TSS1500, TSS200, 5′UTR, 1stExon, body and 3′UTR. d Barplot of four groups that overlap in each region. Hyper-down represents hyper-methylated and downregulated genes. Hypo-up represents hypo-methylated and upregulated genes. Hyper-up represents hyper-methylated and upregulated genes. Hypo-down represents hypo-methylated and downregulated genes. The y-axis is the number of genes

