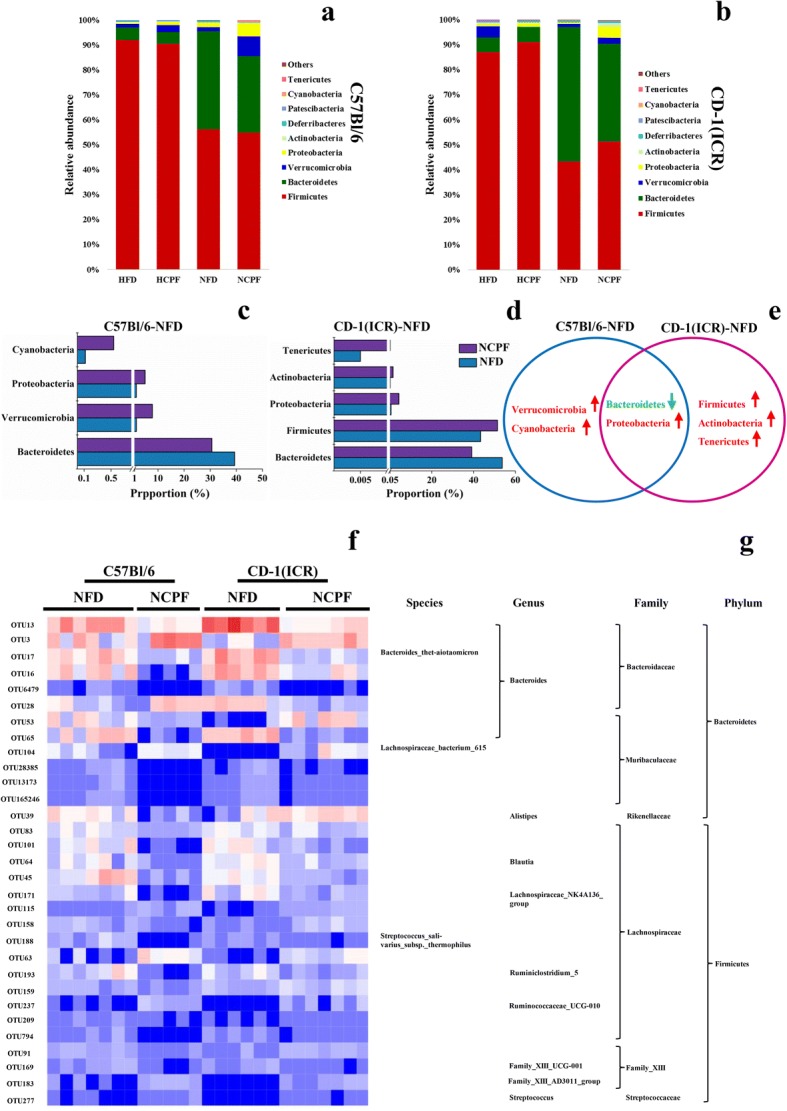
Fig. 5.

Microbiota composition of NFD- and HFD-fed mice treated with or without chlorpyrifos (n = 5 for NCPF of C57Bl/6 mice, n = 6 for NFD of CD-1 (ICR) mice, n = 7 for the rest). Relative abundance distribution of bacterial phyla from fecal metagenomes of NFD, NCPF, HFD, and HCPF mice at week 12 (a, b). Statistical comparisons of gut metagenomic profiles at phyla level of NFD and NCPF mice (c, d, and e). Only features (phyla) with a P value of < 0.05 were shown. Heatmap showing the abundance of 31 OTUs was significantly altered by chlorpyrifos in both NFD-fed C57BL/6 and CD-1 (ICR) mice (P < 0.05), blue and red signify underrepresented and overrepresented respectively (f, g). Data are expressed as the mean ± SEM. NFD normal-fat diet, NCPF normal-fat diet + chlorpyrifos, HFD high-fat diet, HCPF high-fat diet + chlorpyrifos
