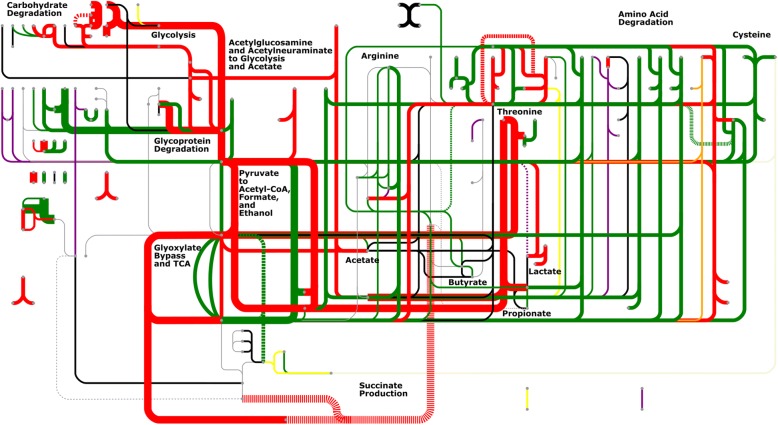
Fig. 3.
Metabolic map of all the GOMixer modules rendered in the GOMixer web application, http://www.raeslab.org/omixer/visualisation/map. Highlighted lines represent all the modules that were inferred with peptide evidence in at least one sample. Line thickness represents how many samples the module was observed in with the thickest lines representing modules that were represented across all samples, the medium thickest lines being represented by modules inferred in all individuals, and the least thick lines representing modules not seen in all individuals. Red colored lines represent modules that were observed in Firmicutes, Actinobacteria, Bacteroidetes, and Proteobacteria. Green lines represent modules that were observed in at least two of the phyla. Black lines represent modules only represented in Firmicutes. Yellow lines represent modules only observed in Bacteroidetes. Purple lines represent modules only represented in Proteobacteria. Two modules that were unique to other phyla were MF0027 inferred in Euryarcheota and MF0010 inferred in Fusobacteria. These were colored beige and orange respectively

