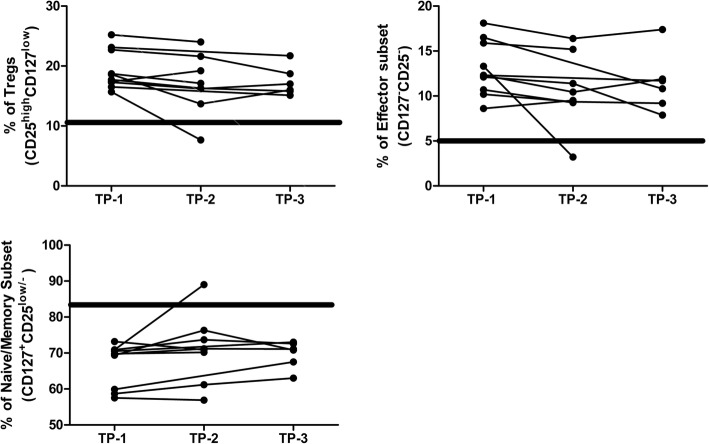
Fig. 5.
Prospective data analysis of CD4+T cell subsets. Graphical presentation of CD4+T cell subset frequencies from 10 ART-receiving (for more than one year) HIV-1 infected individuals at 3 months (TP-2) and 18 months (TP-3) after enrolment (TP-1). Bold rectangular line represents the mean ± SEM frequency of corresponding CD4+ T cell subset in seronegative individuals (n = 33)

