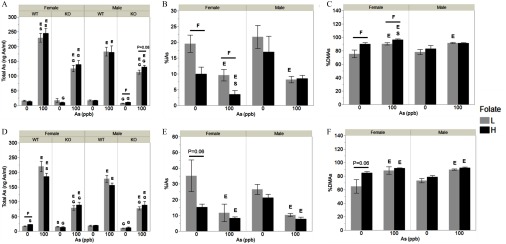
Figure 2.
Total arsenic (i.e., sum of arsenic species) and percentages of arsenic (As) species in urine of male and female wild-type (WT) and As3mt-knockout (KO) mice fed a low (L) or high folate (H) diet and exposed to 0 or inorganic arsenic (iAs) in drinking water, before and after switching from the low-fat (LFD) to the high-fat diet (HFD): Total As, in urines of WT and KO mice after 6 weeks on the LFD (A) and at sacrifice (i.e., after 37 weeks of exposure and 13 weeks of the HFD) (D). Percentage inorganic arsenic (%iAs) (B) and percentage dimethylarsenic (%DMAs) (C) in urines of WT mice after 6 weeks on the LFD; %iAs (E) and %DMAs (F) in urines of WT mice at sacrifice. for ; specific N numbers per group are reported in Table 1. using post hoc Student’s t-test unless otherwise noted for the following comparisons: S, males vs. females of the same diet, exposure, and genotype; F, low vs. high folate intake animals of the same genotype, exposure, and sex; G, WT vs. KO mice of the same sex, diet, and exposure; and E, 0 vs. iAs-exposed mice of the same sex, genotype, and folate level.

