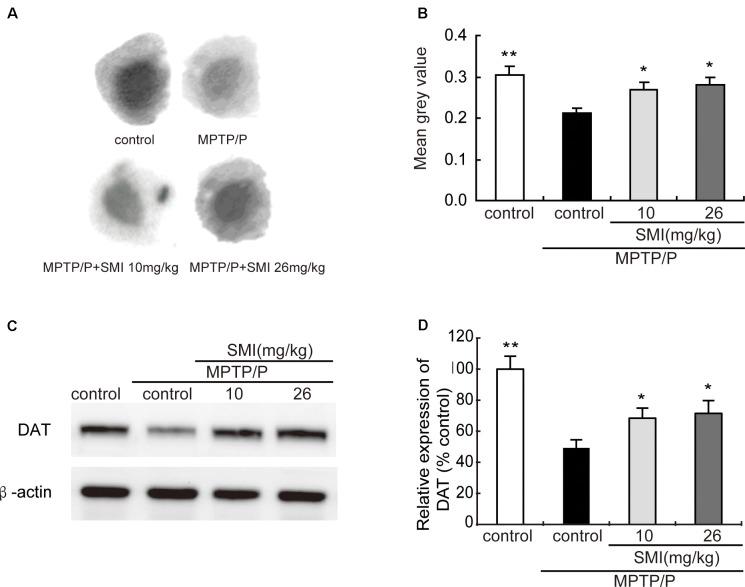
Figure 5.
Effect of SMI on striatal dopamine transporter (DAT) density and protein level in chronic MPTP/probenecid-lesioned mice. Panel (A) shows representative autoradiographic images of the control mice, model mice treated with vehicle, 10 mg/kg/d, and 26 mg/kg/d SMI successively. Panel (B) shows the statistical results (n = 7). Panel (C) shows representative western blot bands of DAT. Panel (D) shows relative protein expression levels were quantified by densitometry analysis using Image J software on DAT bands (n = 4). Data are expressed as mean ± SEM. *P < 0.05 and **P < 0.01, respectively as compared with untreated model group, respectively.

