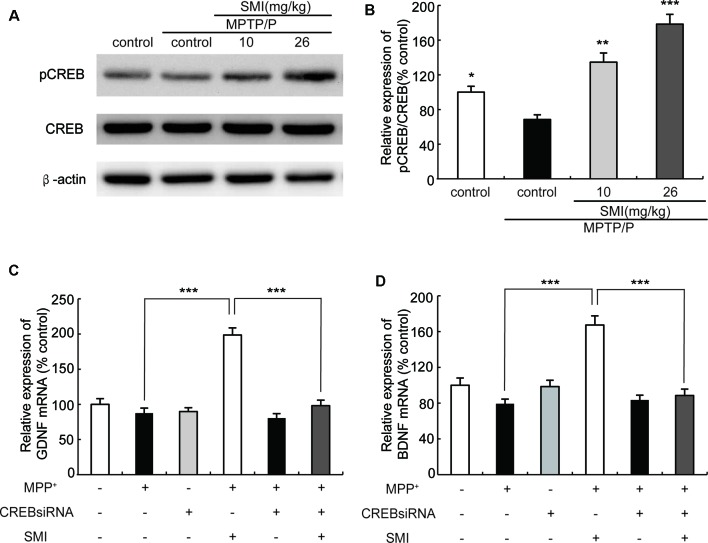
Figure 8.
Effect of SMI on cyclic AMP responsive element binding (CREB) phosphorylation in chronic MPTP/probenecid-lesioned mice and CREB siRNA on mRNA expression of GDNF and BDNF in MPP+ treated SH-SY5Y cells. Panel (A) shows western blot bands of CREB and phosphorylation ofCREB (pCREB). Panel (B) shows relative expression of pCREB/CREB were quantified by densitometry analysis using Image J software on CREB and pCREB bands (n = 4). Data are expressed as mean ± SEM, *P < 0.05, **P < 0.01 and ***P < 0.001, respectively as compared with untreated model group, respectively. Panels (C,D) show relative expression of GDNF and BDNF mRNA by real time PCR. Data are expressed as mean ± SEM, ***P < 0.001.

