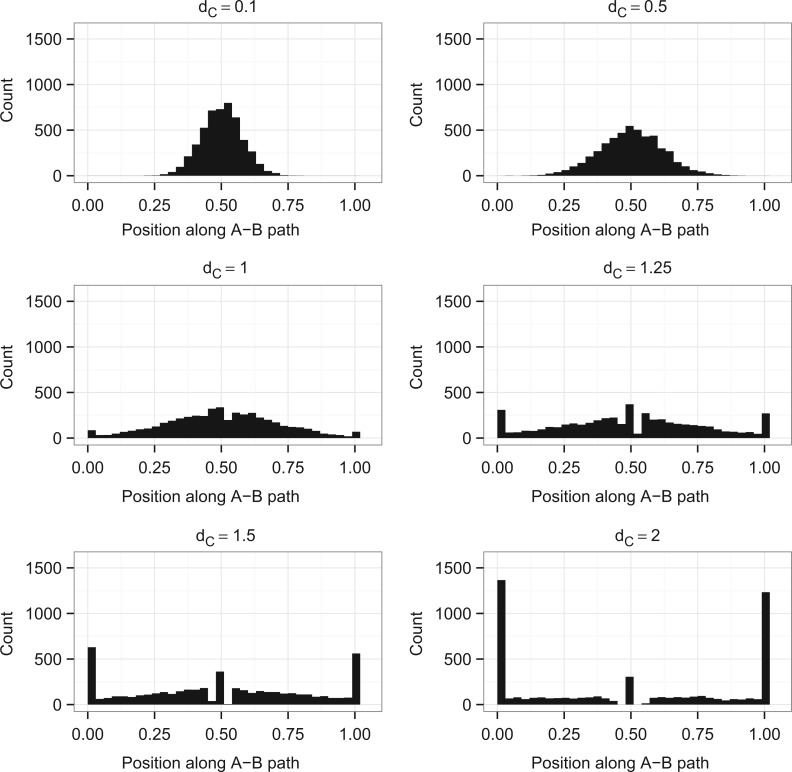
Figure 3.
Distributions of the location of the branch leading to C on the A–B path for trees simulated with dC = 0.1,0.5,1,1.25,1.5,2. For each value of dC, 5000 data sets were run; those that produced a tree with a predicted infinite branch length are not plotted: this corresponds to 0, 0, 0, 0, 1, and 92 data sets, respectively. The distributions of dC and dA + dB along with plots of the position of C against dC and dA + dB are shown in Supplementary Figures 1–4 available on Dryad; http://dx.doi.org/10.5061/dryad.rp7qv.

