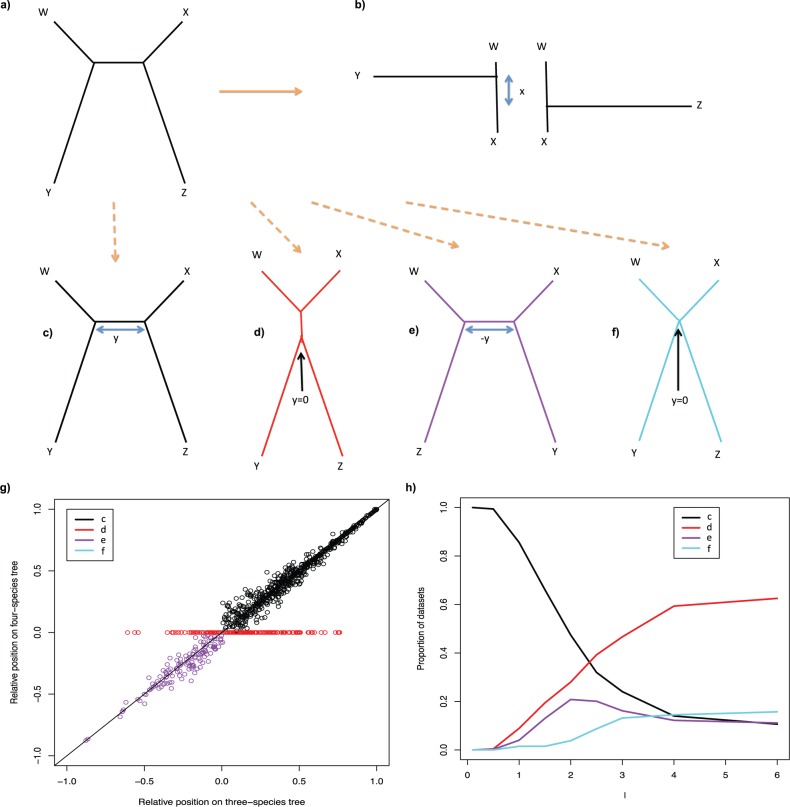
Figure 8.
a) The four-taxon tree used for simulations. The path between W and X is always of length 0.1 with Y and Z evenly spaced along it. The simulated data are used to construct the ML three-taxon trees (W,X,Y) and (W,X,Z), b), and the ML four-taxon tree (one of c–f). Distances x and y, as indicated in b–f, measure the inferred distance between the branches to taxa Y and Z. g) The relative position of Y and Z on the W–X path on the three-taxon trees (x-axis) versus that on the optimal four-taxon tree (y-axis). Lengths of 1.5 are used for branches to Y and Z; equivalent results are seen for other lengths. h) The proportions of different topologies obtained for different lengths of Y and Z.

