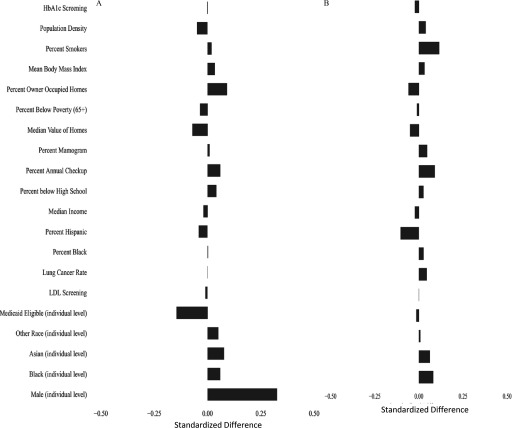
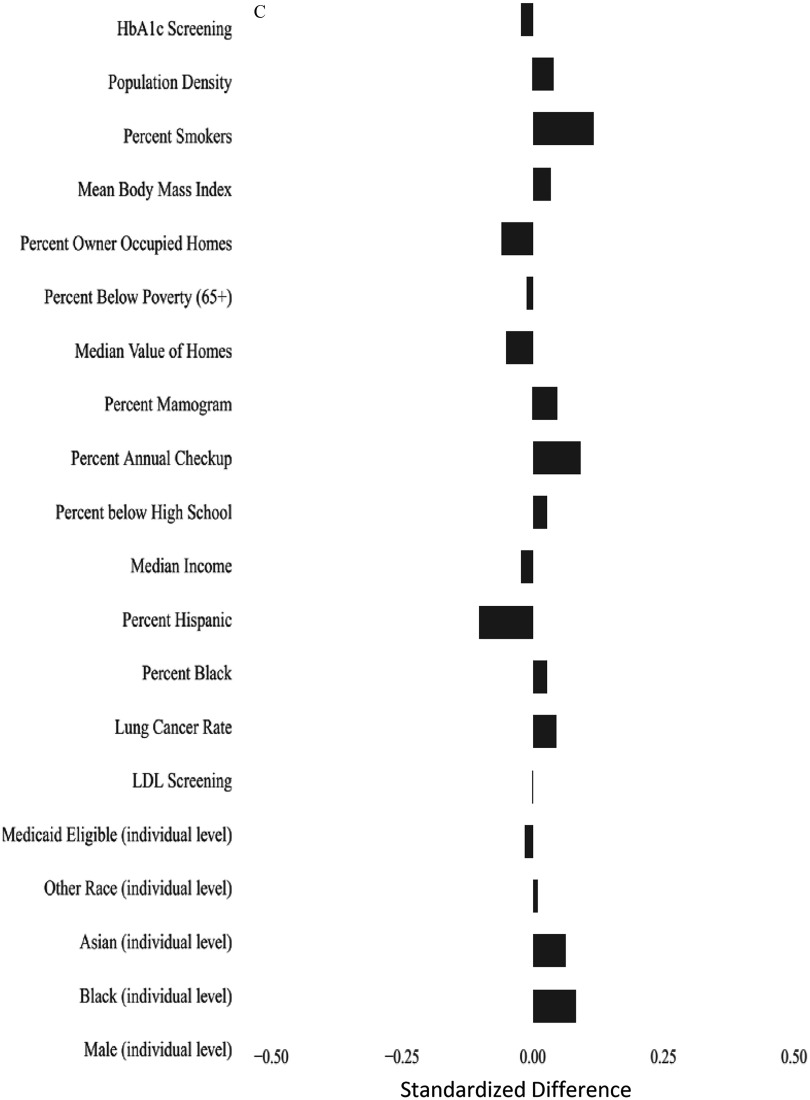
Figure 1.
Standardized mean differences in covariates between observations above and below the mean annual concentrations of after weighting using the propensity score. (A) Standardized differences in the entire cohort; (B) standardized differences in women; and (C) standardized differences in men. The propensity score was fit using the following individual covariates male, black, Asian, other race, Medicaid eligible and the following area-based variables percentage of people y of age who had screening for low-density lipoprotein cholesterol that year, percentage of women y of age who had a mammogram that year, percentage of people y of age who had hemoglobin A1c measured that year, percentage of people y of age who had an annual checkup that year, all by hospital catchment area; lung cancer hospitalization rate in the Medicare population, percentage of population that is black, percentage of population that is Hispanic, median household income, median value of owner-occupied housing, percentage of housing occupied by owner, percentage of persons y of age with less than a high school education, and population density, all by ZIP code; and mean body mass index in the county and smoking rate in the county. In addition, interaction terms were included for percentage black × population density, Medicaid eligibility × population density, and male sex ×population density. Nonlinear terms were used for percentage of the population that was black, median household income, percentage with less than a high school education, percentage with an annual checkup, median value of housing, percentage below poverty level, population density, percentage owner-occupied housing, percentage with HbA1c screening, percentage of women with mammograms, and percentage of smokers.


