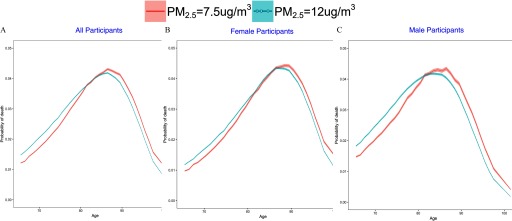
Figure 2.
Nonparametric estimate of the probability of death according to age (in years) under two different counterfactual annual average concentrations just meeting the 2012 U.S. EPA standard of vs. for (A) the entire cohort, (B) women, and (C) men. Estimates were generated using separate logistic regressions for each year of age. The shaded area displays the 95% confidence intervals about the curves.

