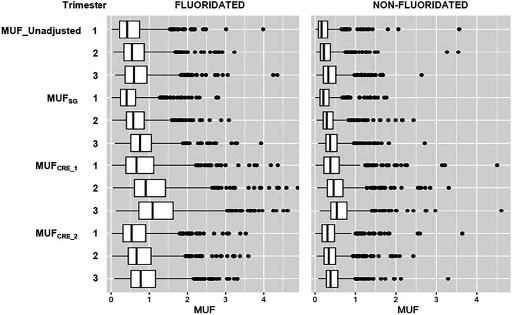
Figure 1.
Fluoride concentrations by trimester in the urine of pregnant women from the MIREC cohort living in fluoridated versus nonfluoridated communities. MUF (maternal urinary fluoride) levels are shown unadjusted and adjusted for specific gravity (; Equation 1) and creatinine using two different methods ( and ; Equations 2 and 3, respectively). Box plots display the upper and lower quartiles of the data; the median is marked by the vertical line inside the box. The whiskers show the 5th and 95th percentile, whereas the individual data points represent values that exceed the 95th percentile. Box plots were produced after removing outliers defined as a MUF concentration .

