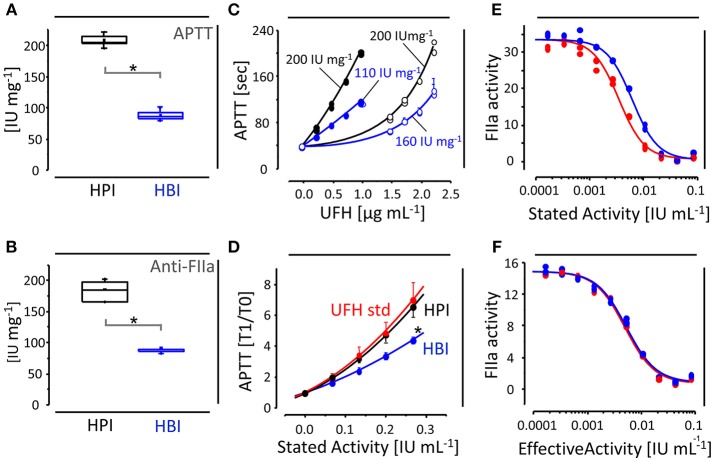
Figure 2.
Anticoagulant activities of HBI and HPI. Average anticoagulant activities (IU mg−1) of HBI (in blue) and HPI (in black) APIs achieved in APTT (A) and anti-FIIa assays (B). (C) APTT assays performed with human (closed circles) or ovine (open circles) plasma; note the overestimated potencies achieved by HBI (in blue) but not HPI (in black) in the assays with ovine plasma. (D) APTT assays with HPI formulations (in black) based on stated potencies of 180 IU mg−1 yield curves coincident to the International Heparin Standard (in red), while HBI final products (in blue) based on overestimated potencies (140–160 IU mg−1) achieve potencies significantly lower. Anti-FIIa-based parallel line assays showing curves of the International Heparin Standard (in red) and HBI formulations (in blue) based on the potency stated by the manufacturer (E) and effectively determined by us (F). *in the panels indicate significant differences (p < 0.05). The graphs depicted in the panels are based on results previously published (6–11, 13, 15).

