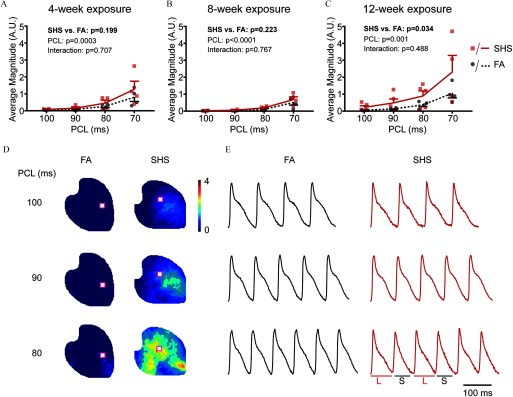
Figure 2.
Effect of SHS on APD alternans. (A–C) Average APD spectral alternans magnitude is plotted against the pacing cycle length (PCL) following (A) 4- (), (B) 8- (), and (C) 12- (FA ; SHS ) wk of exposure to FA (circles) or SHS (squares). Data was analyzed with two-way analysis of variance (ANOVA) with Tukey’s posthoc test. Data is shown as . (D) Representative APD alternans magnitude maps following 12 wk of exposure at decreasing PCLs. (E) Representative optical traces from the location indicated in square cutout red box in (D). Note: APD, action potential duration; FA, filtered air; L, longer APD; PCL, pacing cycle length; S, shorter APD; SHS, secondhand smoke.

