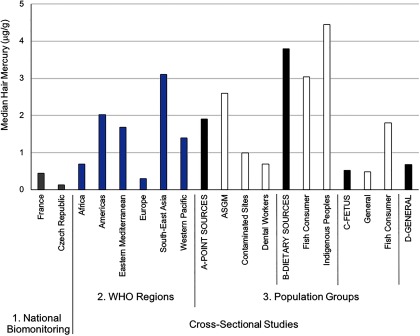
Figure 4.
Median hair mercury levels across different population groups. The National Biomonitoring Studies (#1) provide country representative information on exposures. For the Cross-Sectional Studies, all data are organized according to WHO geographic region (#2) and Populations Groups (#3) that were set a priori. Under the four main Population Groups categories, the first bar (black shade) represents the pooled biomarker data from the respective subgroups that follow (indicated in white shade). Subgroups that fall under the Point Sources group include ASGM (individuals engaged in artisanal and small-scale gold mining); Contaminated Sites (individuals living at contaminated sites); and Dental Workers (individuals exposed from working in dental settings). Subgroups that fall under the Dietary Sources group include Fish Consumer (non-Indigenous or non-Arctic groups that were identified in the study as being ones who consume relatively high amounts of seafood) and Indigenous Peoples (self-identified group by study authors and mainly composed of populations from the Amazonian region). Subgroups that fall under the Fetus group include General (background population without specific exposures to mercury) and Fish Consumer, see above under “Dietary Sources.” The General group refers to the background population without specific exposures to mercury. Note: WHO, World Health Organization. For source data, see Table S6.

