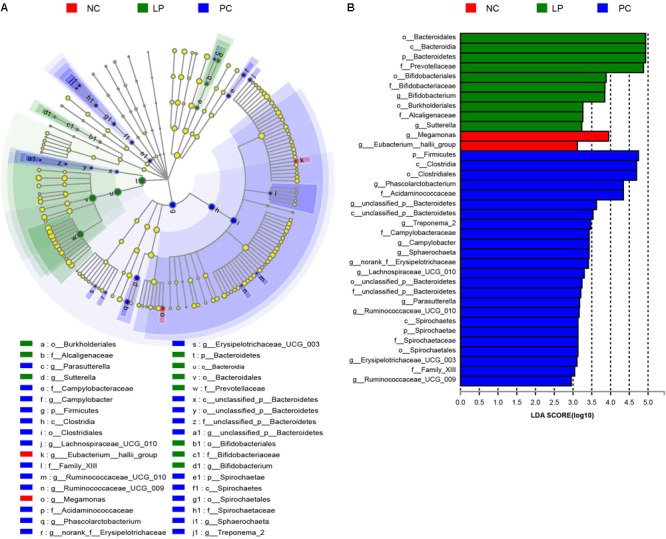
FIGURE 3.

LefSe analysis of colonic microbial community in weaning piglets from NC, PC, and LP groups. (A) Cladogram showing microbial species with significant differences in NC, LP, and PC groups. Red, green, and blue indicate different groups, with the species classification at the level of phylum, class, order, family, and genus shown from the inside to outside. The red, green, and blue nodes in the phylogenetic tree represent microbial species that play important roles in the NC, LP, and PC groups, respectively. Yellow nodes represent species with no significant difference. (B) Species with significant difference that have an LDA score greater than the estimated value with the default score 3. The length of the histogram represents the LDA score indicating the difference of species in the three groups.
