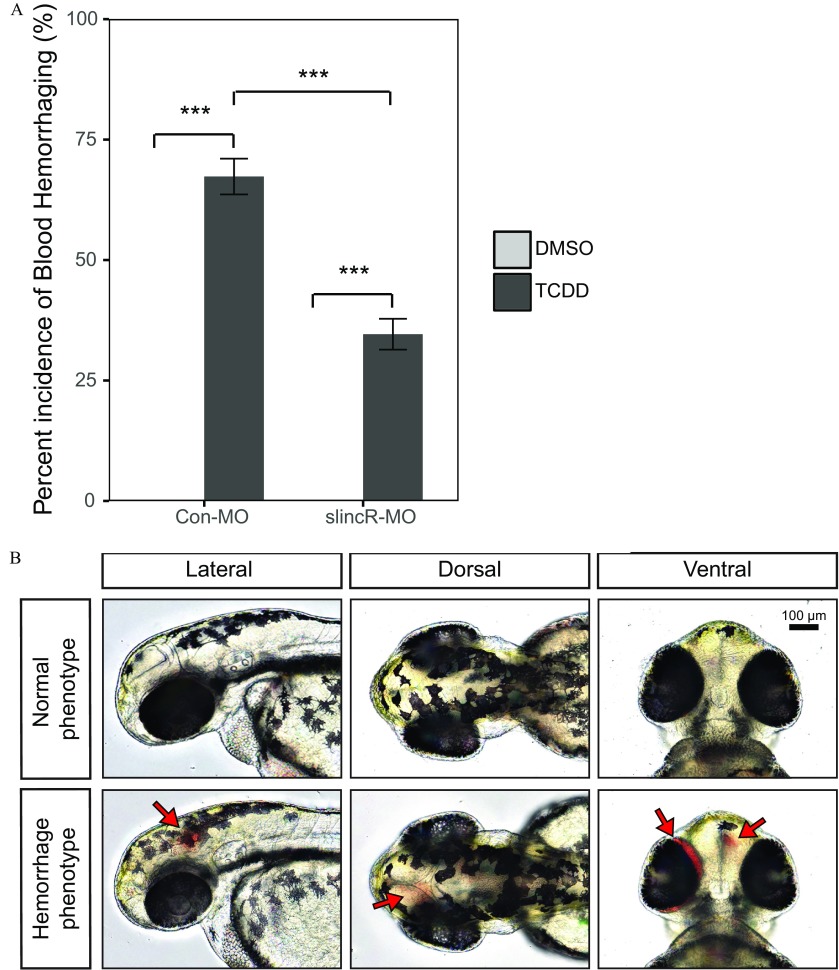
Figure 5.
TCDD-induced hemorrhaging in control and slincR morphants. Control (Con-MO) and slincR morphants (slincR-MO) were developmentally exposed to 0.1% DMSO or TCDD, and zebrafish embryos were evaluated for the presence or absence of hemorrhaging. (A) The percent incidence of the hemorrhaging phenotype in control and slincR morphants exposed to DMSO or TCDD. The DMSO and TCDD samples consisted of 3 and 5 biological replicates, respectively. Each biological replicate contained 10–12 individual zebrafish. All error bars indicate standard error of the mean. Statistical significance was determined using the Type III one-way ANOVA for unbalanced experimental designs from the car package with a Tukey post hoc test ( or 5, ). (B) Representative images of wild-type zebrafish exposed to DMSO (normal phenotype) or TCDD (hemorrhaging phenotype). The bar in the top right corner indicates and arrows point to sites of hemorrhaging. Note: ; ; .

