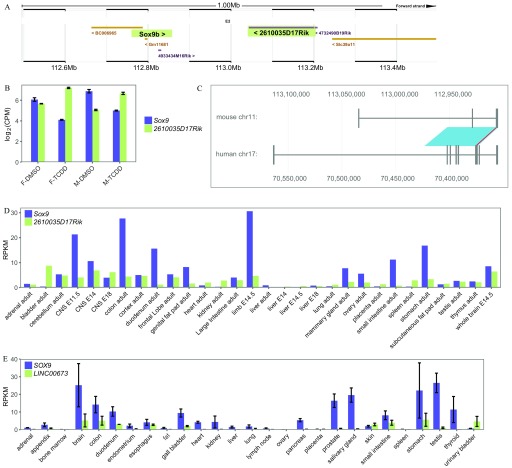
Figure 6.
Identification of the potential slincR mouse and human orthologs. We identified the potential mouse ortholog of slincR (2610035D17Rik) based on (A) the conserved genomic location and orientation relative to Sox9 and (B) the significant increase in expression in TCDD-exposed mouse urogenital tissue samples from embryonic day 16.5 ( and ). Each biological sample consisted of RNA from 5–6 pooled mouse urogenital tissue with 3–4 biological replicates per condition. Error bars indicate standard error of the mean. The image from (A) was downloaded from the Ensembl mouse genome (GRCm38), and Sox9 and 2610035D17Rik are highlighted. (C) Downloaded and formatted image from the slncky Evolution Browser of the mouse (2610035D17Rik) and human (LINC00673) conserved lncRNA orthologs. To determine the tissue-specific expression of (D) mouse- (2610035D17Rik) and (E) human-conserved (LINC00673) lncRNAs relative to Sox9/SOX9, we downloaded RNA-seq expression data from NCBI BioProjects PRJNA66167 and PRJEB4337, respectively. Error bars indicate standard error of the mean. Note: ; .

