FIGURE 1.
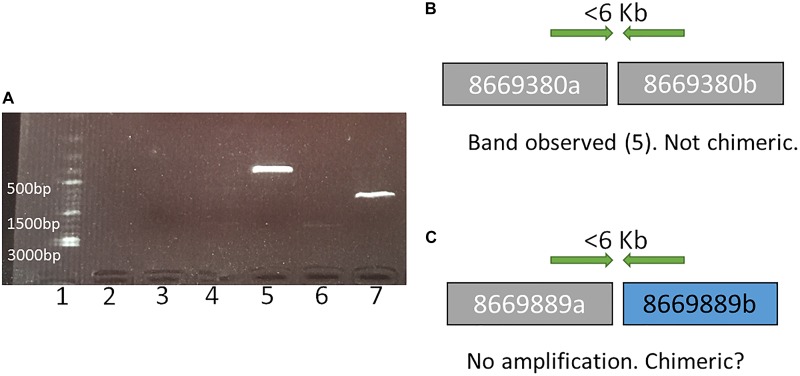
An example of representation and interpretation of the results of polymerase chain reaction (PCR) run I. (A) an electrophoresis gel, where in well 1 is a DNA ladder, 2 is the control (no DNA), 3 and 4 exhibit no PCR amplification for tested SF adjacencies in scaffolds 8669889 and 8669009, respectively, broken by RACA; 5 and 7 show PCR amplification for tested SF adjacencies in scaffolds 8669380 and 8669417, respectively, broken by RACA; 6 shows PCR product of unexpected size (2000 bp) for scaffold 8667696. (B) A schematic representation and interpretation of the PCR results from well 5 (scaffold 8669380, SFs 8669380a and 8669380b); (C) A schematic representation and interpretation of the PCR results from well 3 (scaffold 8669889, SFs 8669889a, and 8669889b).

