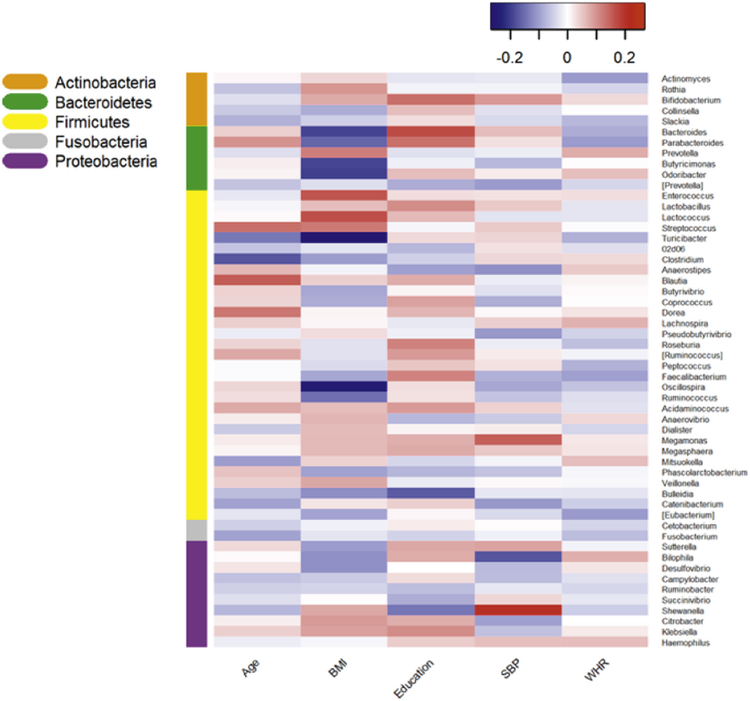
Fig. 1.
Heatmap of Spearman's partial correlations summarizing the associations of selected demographic, lifestyle, and anthropometric characteristics (x-axis) with relative abundance of individual bacterial genera (y-axis). The coefficients were adjusted for sex, age, BMI, smoking, and education. Color-coding adjacent to the vertical dendrogram corresponds to phylum membership of the taxa for that row of the heatmap. BMI = body mass index, SBP = systolic blood pressure, WHR = waist-to-hip ratio.

